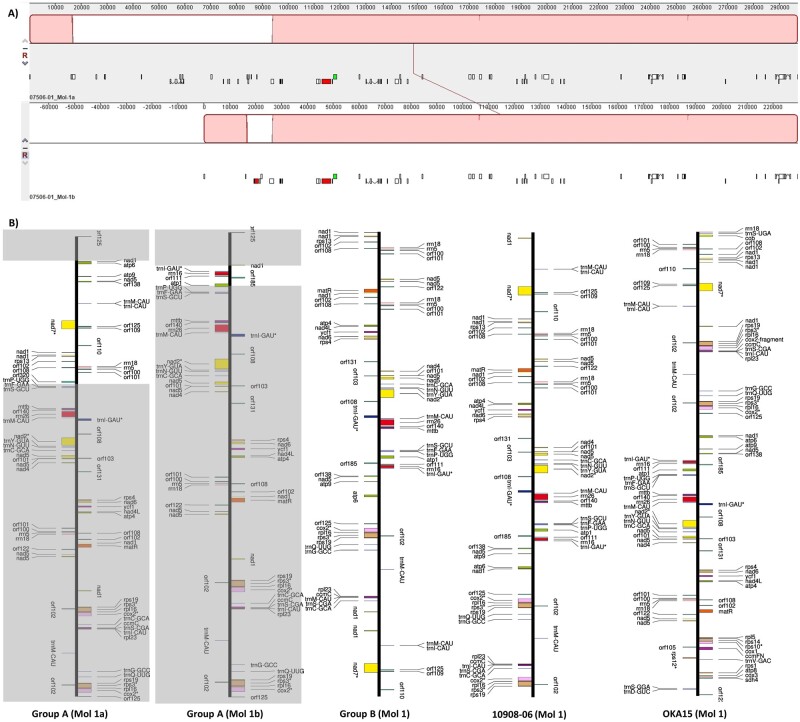
Figure 1.
Comparison of molecule 1a and 1 b of group A mitogenomes (07506-01 is used to show the comparison). (A) Red blocks show the identical region between molecule 1a and 1 b, approximately 219 kb of sequence is identical between these two molecules. (B) Comparison of molecule 1 from each group, the grey boxes represent shared sequence between molecule 1a and 1 b of group A. The gene content and gene organization in molecule 1 of each group is represented here. The molecules are shown as linear maps for easier comparison.

