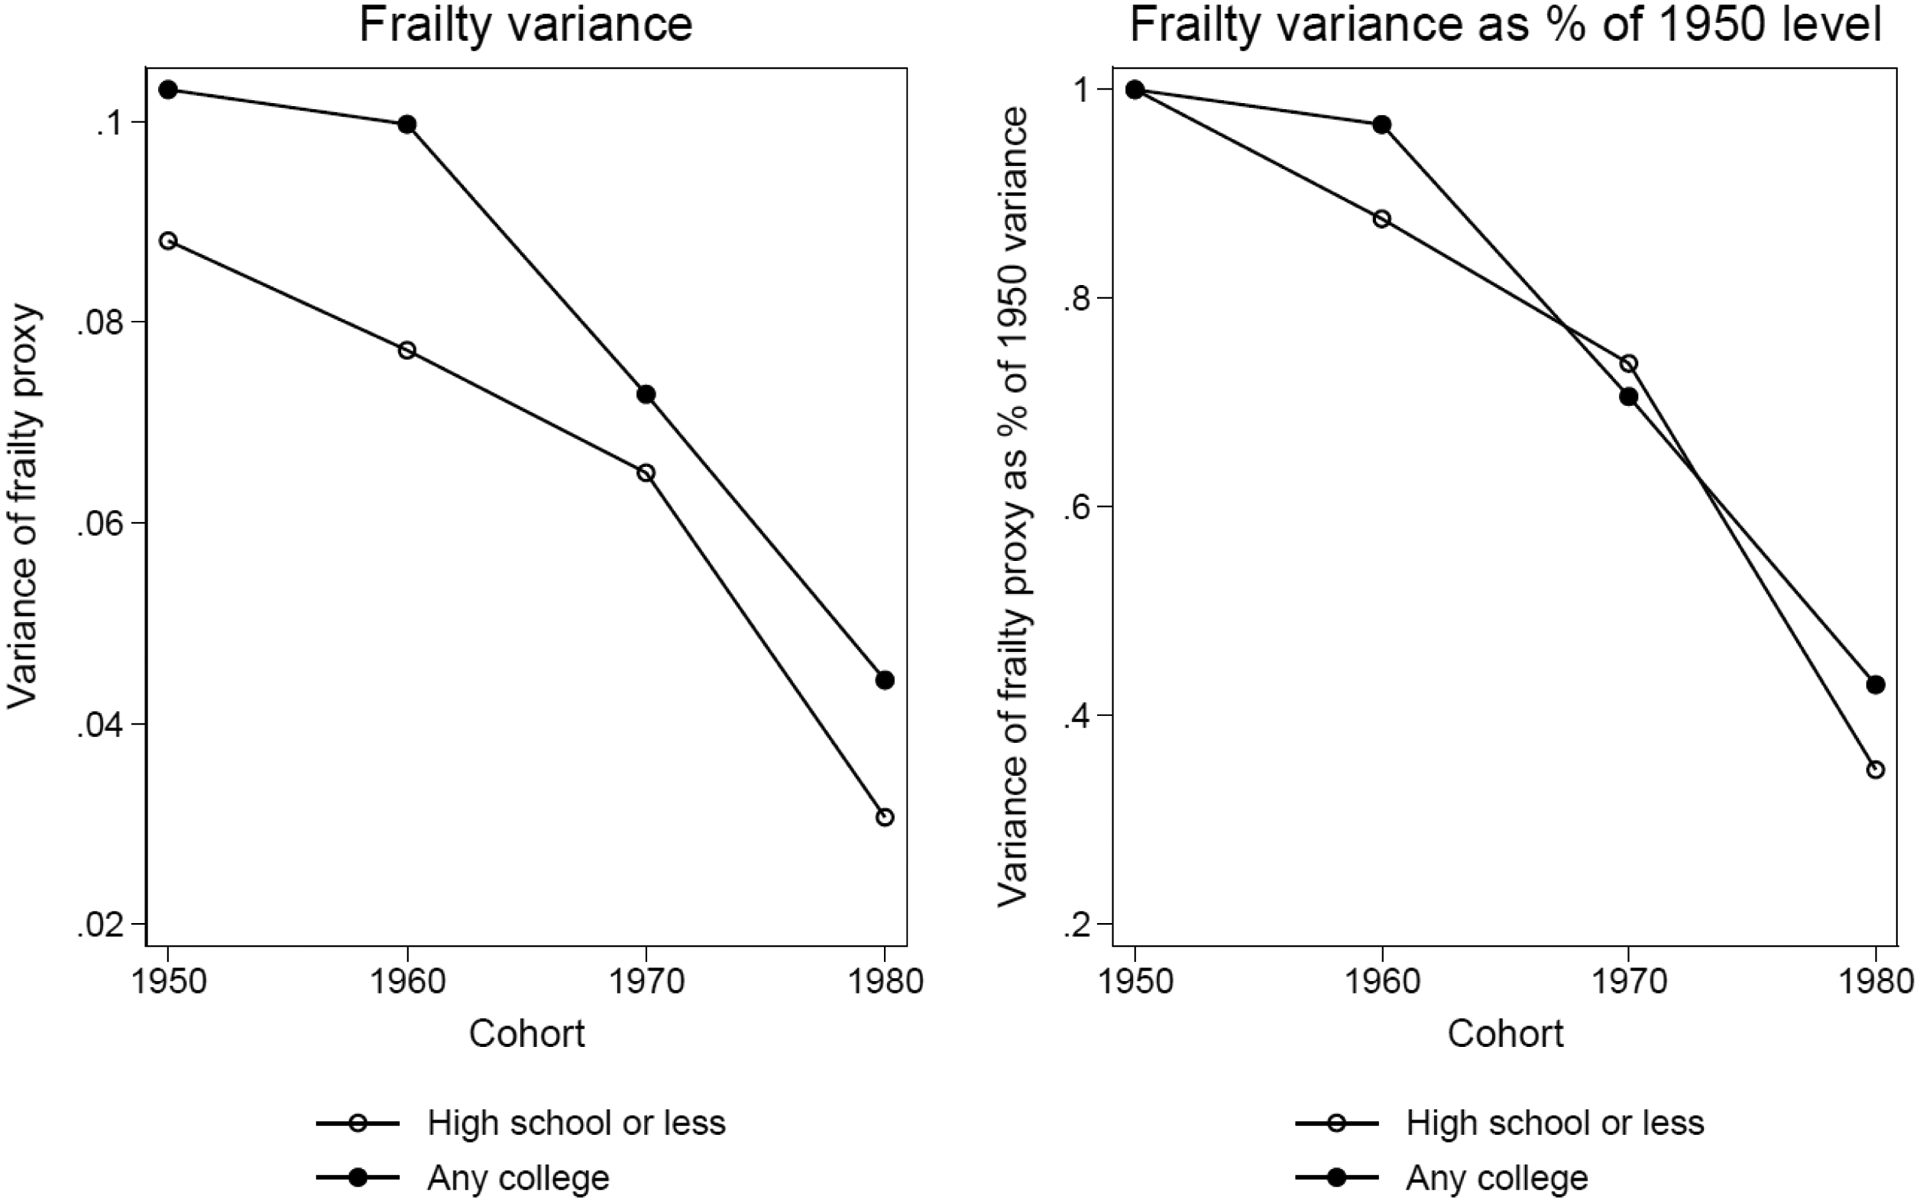
Appendix Figure A-7.

Absolute frailty variance and relative frailty variance as a percentage of the 1950 level for high school or less and any college groups from NHANES 1999–2012
Notes: Data are from NHANES 1999–2012. Sample consists of all individuals born from 1950–1989 who had information on early life disease measures before age 17. Sample size for these four cohorts is 22,181.
