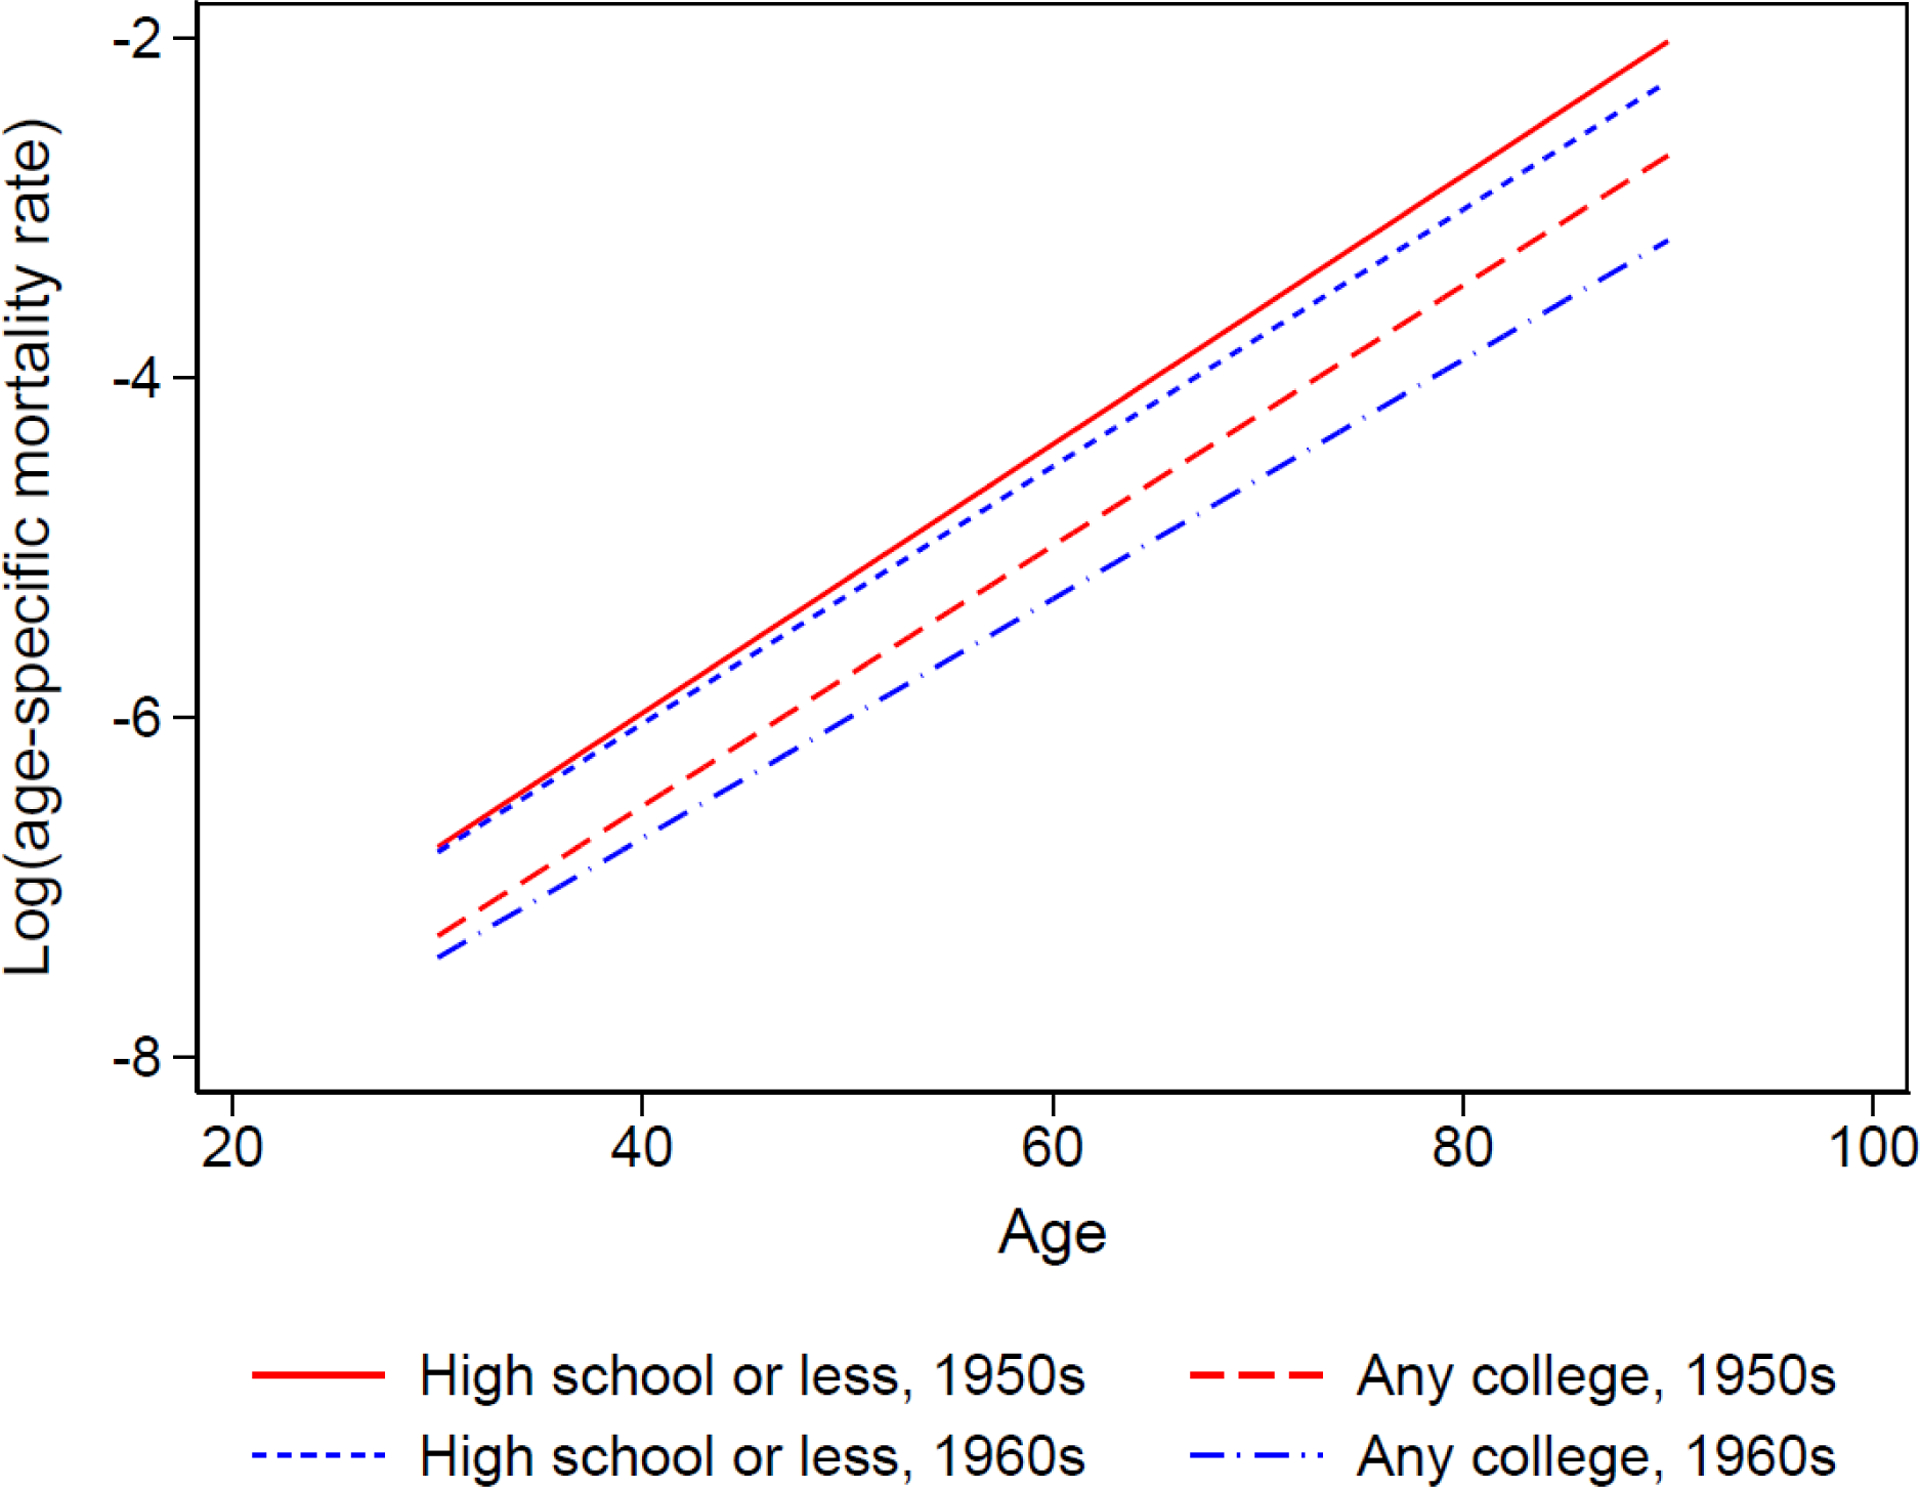
Figure 6.

Observed and extrapolated mortality patterns for two education groups in the 1950s and 1960s birth cohorts from NHIS 1986–2009 with linked mortality through 2011
Notes: Data are from NHIS 1986–2009 surveys linked to mortality data through 2011. Sample size for the 1950s and 1960s birth cohorts is 575,705 experiencing 23,665 deaths and 8,509,452 person-years of exposure. Following the Gompertz function of age-dependent mortality pattern, we use a linear function of log mortality rate to extrapolate mortality rates up to age 90.
