Figure 1.

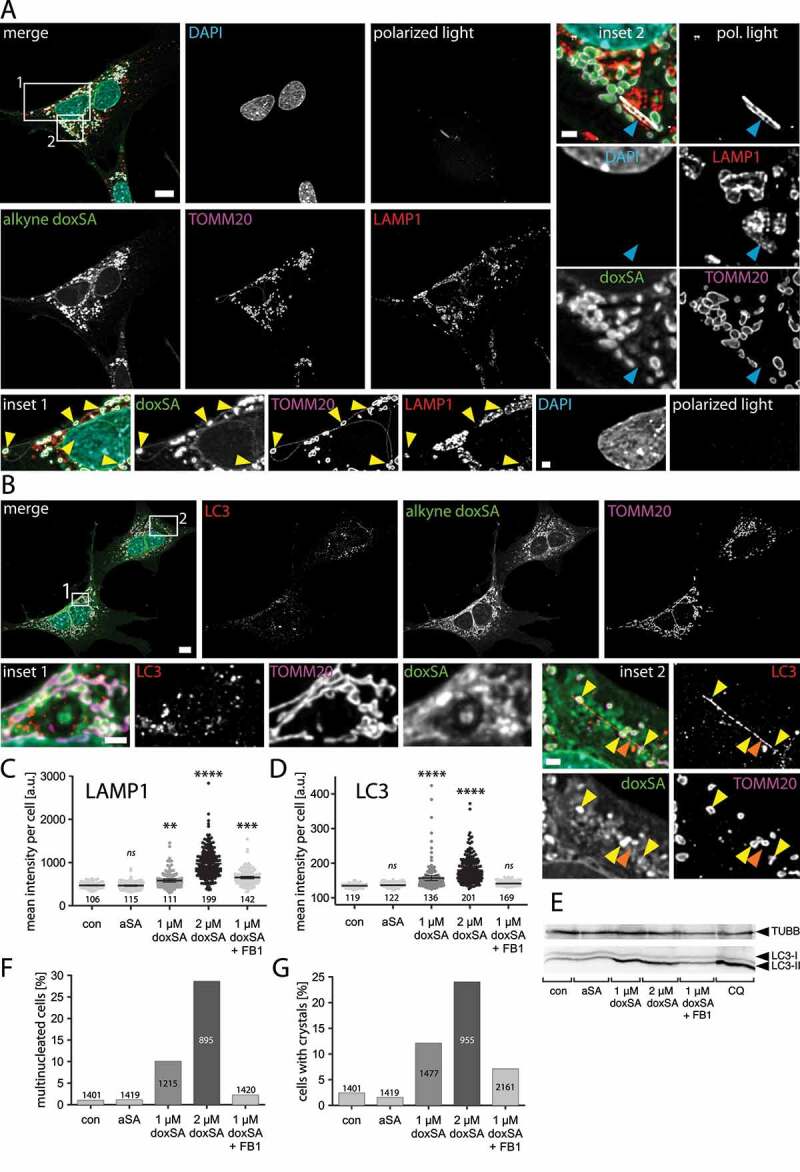
1-Deoxysphingolipids induce vesicle accumulation in the autophagosomal apparatus and block cell division. MEF cells were treated with 1 μM doxSA mix (0.9 μM doxSA + 0.1 μM alkyne doxSA tracer) for 24 h. After fixation cells were probed for various organelle markers by immunofluorescence and the alkyne moiety was reacted with N3Cy3-reporter. Micrographs were recorded using structured illumination. (A,B) Maximum image projections of z-stacks after deconvolution depict alkyne lipids (green, doxSA), nuclei (cyan, DAPI), mitochondria (magenta, TOMM20), lysosomes (red, LAMP1), autophagosomes (red, LC3) as color-merged or grayscale images. Polarized light microscopy revealing birefringent structures was also performed (A). Note the alkyne lipid-positive mitochondria interconnected by membrane tubules (A, inset 1, yellow arrowheads) and the birefringent crystal overlapping the lysosomal signal and neighboring alkyne lipid-positive mitochondria (A, inset 2, blue arrowhead). Also note the rod-like LC3-II-positive structure (B, inset 2, orange arrowhead) neighboring alkyne lipid-positive mitochondria (yellow arrowheads). Scale bars, 10 μm or 2 μm (insets). (C,D,F,G) Semi-quantitative analysis of cellular structures from micrographs exemplarily illustrated in Figures S1 and S2. MEF cells were treated with carrier (no lipid control), 1 μM alkyne sphinganine (aSA), 1 or 2 μM doxSA mix, or 1 μM doxSA mix + 25 μg/mL ceramide synthase inhibitor fumonisin B1 (1 μM doxSA + FB1) for 24 h. Mean intensity values per cell of signals for LAMP1 (C) or LC3 (D) are plotted with ±95% confidence interval. Statistical differences were calculated by ANOVA followed by Dunnett’s Multiple Comparison Test. Adjusted P values: **** p < 0.0001; *** p < 0.001; ** p < 0.0025; ns – not significant; all vs. untreated control. Percentage of multinucleated cells (F) or cells with birefringent crystals (G) are graphed. Bar number indicate the cell number considered. (E) Analysis of cellular content of LC3 and TUBB by western blotting. Cells treated with 50 μM chloroquine (CQ) served as positive control
