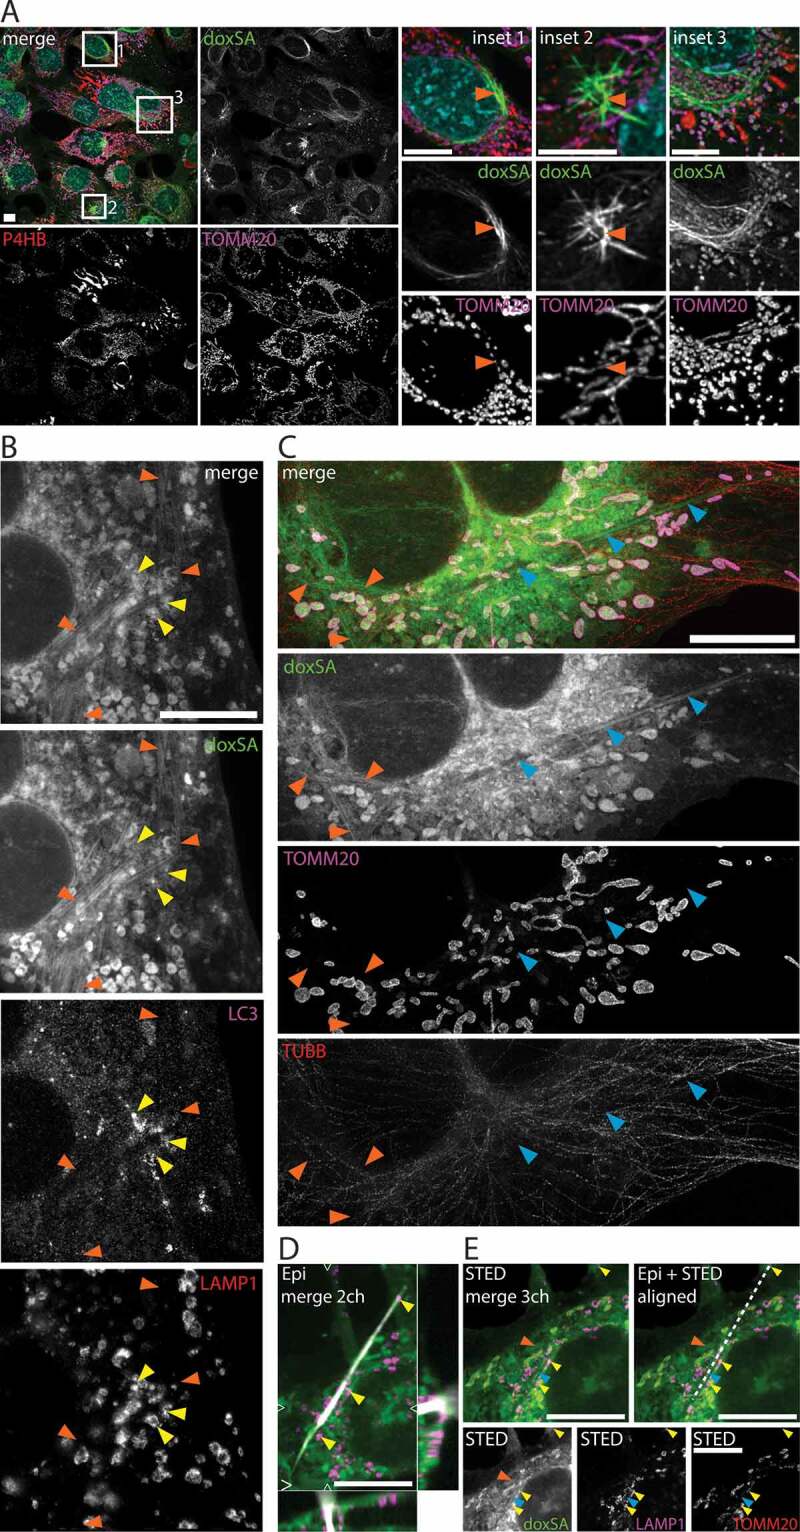
Figure 3.

1-Deoxysphingolipids induce various cellular lipid aggregates. MEF cells were treated with (A) 1 μM alkyne doxSA or (B-E) 1 μM doxSA mix (0.9 μM doxSA + 0.1 μM alkyne doxSA tracer) for 24 h. After fixation cells were probed for various organelle markers by immunofluorescence and the alkyne moiety was reacted with ASTM-BODIPY (A) or N3635P-reporter (B–E). Micrographs were recorded using structured illumination (A,D) or STED (B,C,E) microscopy. (A) Maximum image projections of z-stacks after deconvolution depict alkyne lipids (green, doxSA), nuclei (cyan, DAPI, merge+insets), mitochondria (magenta, TOMM20), endoplasmic reticulum (red, P4HB, merge) as color-merged or grayscale images. Note the lipid aggregates (insets, orange arrowheads). (B,C) Single-layer super-resolution micrographs depict lysosomes (red, LAMP1), autophagosomes (magenta, LC3), and TUBB (red) as color-merged or grayscale images. Other channel colors are as above. Note the straight hollow profiles of lipid aggregates (orange arrowheads) distinguishable from filled crystal-like structures (blue arrowheads) both positive for alkyne lipids. Also note the autophagosomal structures positive for LC3-II and LAMP1 neighboring the lipid aggregates (yellow arrowheads). (D,E) Correlative Epifluorescence and STED microscopy images showing the same cell as (D) maximum image projection of a z-stack with side views at the indicated positions (open triangles) including the polarized light channel (gray), and (E) as a single-layer super-resolution image with superimposed birefringent crystal (dashed line), aligned using the 3 marked lysosomes (yellow arrowheads) as landmarks. Note the straight crystal-like structure (blue arrowhead), but not the lipid aggregate (orange arrowhead) exhibits birefringency. Bars, 10 μm
