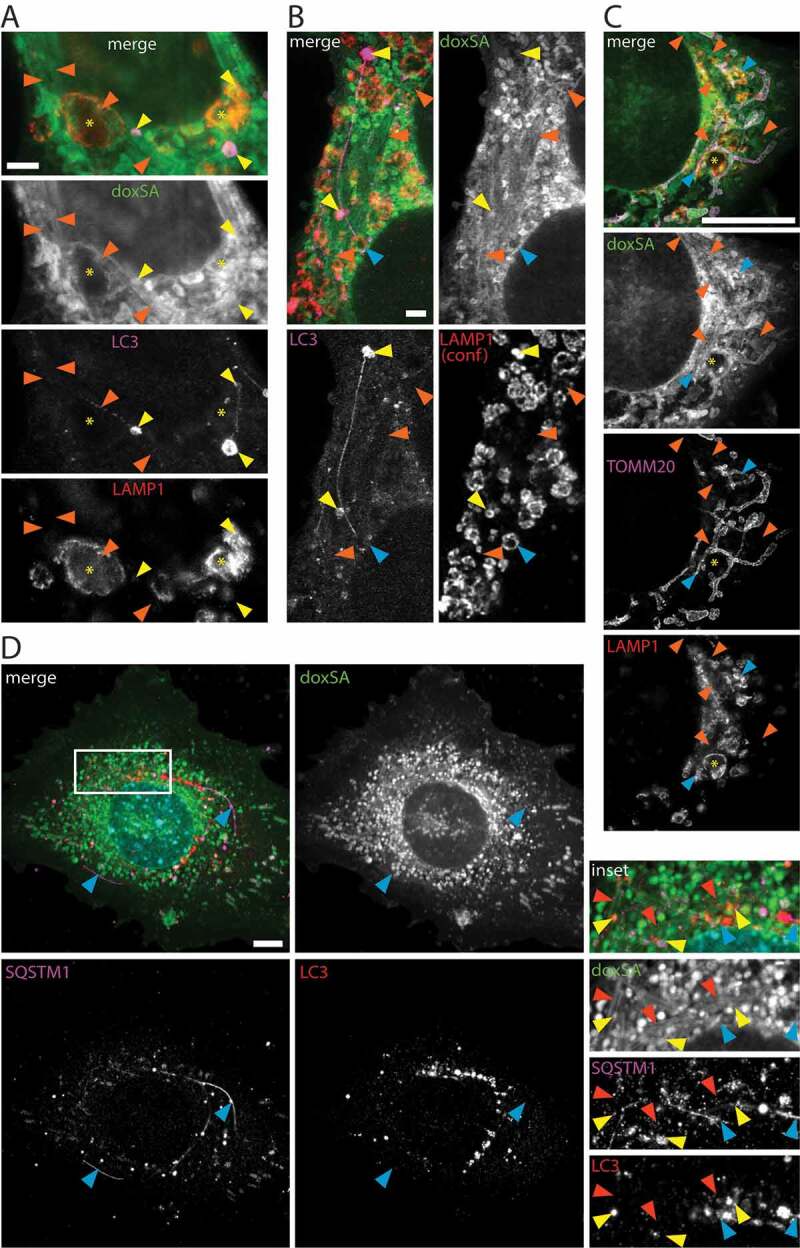
Figure 4.

Lipid aggregates interact with the autophagosomal apparatus. MEF cells were treated with 1 μM (A-C) or 2 μM (D) doxSA mix for 24 h. After fixation cells were probed for various organelle markers by immunofluorescence and the alkyne moiety was reacted with N3635P-reporter (A–C) or N3picCy3-reporter (D). STED-micrographs (A–C) or maximum image projections of z-stacks recorded using structured illumination (D) depict alkyne lipids (green, doxSA), mitochondria (magenta, TOMM20), lysosomes (red, LAMP1), autophagosomes (magenta (A,B, LC3; D, SQSTM1) or red (D, LC3)) as color-merged or grayscale images. Note the straight lipid aggregates (orange arrowheads) neighboring large lysosomes (A,C, asterisks), autolysosomes (A,B, yellow arrowheads) and lysosomes (B, blue arrowheads) interconnected by straight and curved protrusions. Also note the close approximation of lipid aggregates and elongated SQSTM1-positive structures (D, blue arrowheads) and autophagosomes (D, yellow arrowheads). In (B) the LAMP1-signal was recorded as a confocal image. Scale bars, (A,B) 2 μm, (C,D) 10 μm
