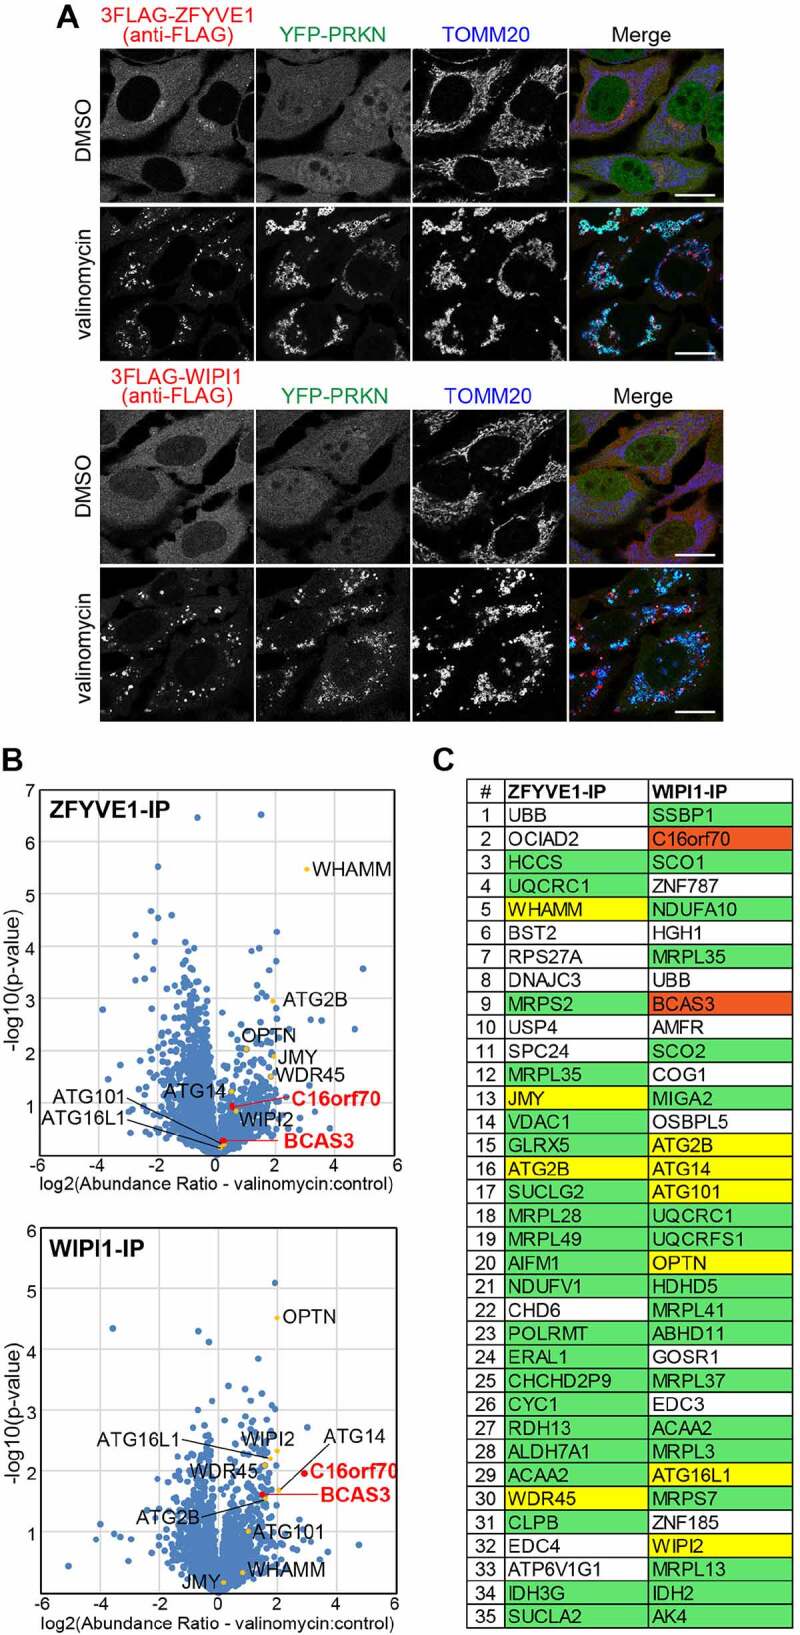
Figure 1.

Co-IP followed by MS analysis of WIPI1-associated proteins during mitophagy identified human BCAS3 and C16orf70. (A) HeLa cells stably expressing YFP-PRKN and 3FLAG-ZFYVE1 or 3FLAG-WIPI1 were treated with dimethyl sulfoxide (DMSO; control) or valinomycin for 3 h and then immunostained. Bars: 20 µm. (B) After treatment with DMSO or valinomycin, the cells in (A) were treated with 0.1% PFA, solubilized, and co-immunoprecipitated with an anti-FLAG/DDDDK antibody and then analyzed by MS. The volcano plots (ZFYVE1-IP – upper panel; WIPI1-IP – lower panel) show the abundance ratios (valinomycin versus control) plotted against the p-value in a – log10 scale for three independent experiments. Yellow dots indicate autophagy-related proteins listed in (C) and red dots indicate BCAS3 and C16orf70. (C) Co-IP proteins in (B) were ranked according to the Proteome Discoverer software-based quantification abundance ratio (valinomycin versus control). Protein designations are based on the UniProt database. Mitochondrial and autophagy-related proteins are highlighted in green and yellow, respectively
