
Figure 3.
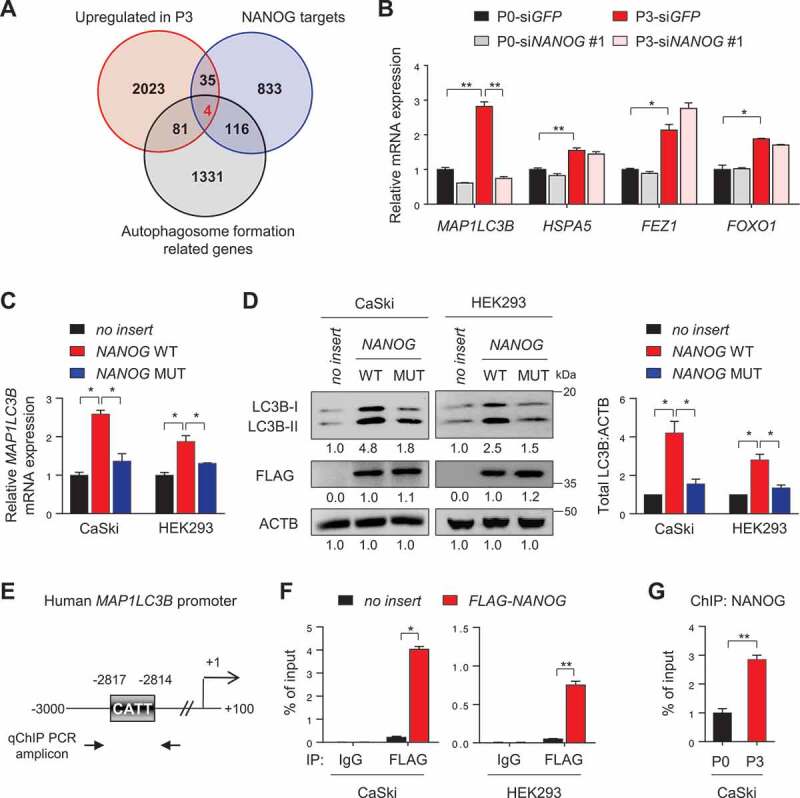
NANOG directly regulates LC3B through promoter occupancy. (A) Venn diagram showing the overlap of genes with upregulated in CaSki P3 versus P0 (red), NANOG target genes from ChIP-ChIP data (blue) and autophagosome formation-related genes (black). (B) CaSki P0 and P3 cells were transfected with siRNA targeting GFP or NANOG, as indicated. mRNA expressions of LC3B, HSPA5, FEZ1 and FOXO1 were analyzed by qRT-PCR. (C and D) CaSki P0 or HEK 293 cells were transfected with empty vector (no insert), FLAG-NANOG wild type (NANOG WT), or FLAG-NANOGE264G;E268G;E272A (NANOG MUT). (C) LC3B mRNA levels were measured by qRT-PCR. (D) Levels of LC3B and FLAG-NANOG proteins were confirmed by western blot. (E) Diagram of the human LC3B promoter region containing the NANOG binding element. The arrows indicate qChIP-PCR amplicon. (F) The cross-linked chromatin from CaSki or HEK 293 cells transfected with empty vector or FLAG-NANOG was immunoprecipitated with mouse IgG or anti-FLAG antibodies. Relative enrichment of FLAG-NANOG on the LC3B promoter region was assessed by qChIP-PCR analysis with primers that amplify genomic region indicated above. The value of ChIP data represents relative ratio to the input. (G) Relative enrichment of NANOG on the LC3B promoter in CaSki P0 and P3 cells was determined by ChIP using anti-NANOG antibody, followed by qPCR analysis. All experiments were performed in triplicate under starved conditions with 0.1% FBS media. *p < 0.01 and **p < 0.001, by one-way ANOVA (B, C and D) or 2-tailed Student’s t-test (F and G). The data represent the mean ± SD