
Figure 6.
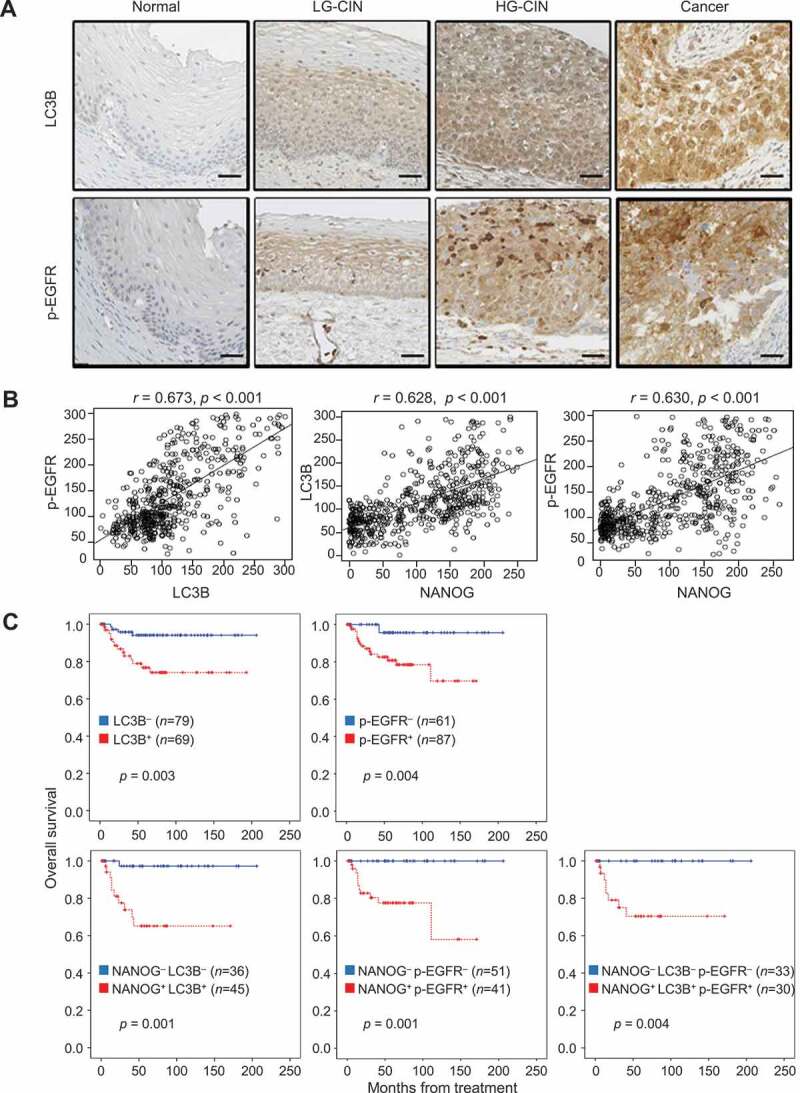
LC3B and p-EGFR significantly correlate with NANOG in human cervical neoplasia specimens. (A) Representative images of IHC staining of LC3B and p-EGFR in cervical tissue from normal, LGCIN, HGCIN, and cervical carcinoma patients. Scale bar: 25 µm. CIN, cervical intraepithelial neoplasia; LG-CIN, low-grade CIN; HG-CIN, high-grade CIN. (B) Correlation between each parameter. LC3B histoscore compared with NANOG and p-EGFR histoscores using a simple scatter plot. (C) Overall survival of cervical cancer patients was analyzed in Kaplan-Meier plots. Patients with high levels of LC3B and p-EGFR expression showed reduced overall survival (log-rank test, p = 0.003 and p = 0.004, respectively) compare with patients with low levels of LC3B and p-EGFR expression. Notably, patients with combined NANOG+ LC3B+, NANOG+ p-EGFR+, NANOG+ LC3B+ p-EGFR+ expression was showed significantly worse overall survival (log-rank test, p = 0.001, p = 0.002, and p = 0.005, respectively) than patients with NANOG− LC3B−, NANOG− p-EGFR−, NANOG− LC3B− p-EGFR− expression. LC3B+, histoscore > 145; p-EGFR+, histoscore > 172. The p-values by Spearman correlation (R) (B) or Log-rank (Mantel-Cox) test (C) were indicated