Figure 2.

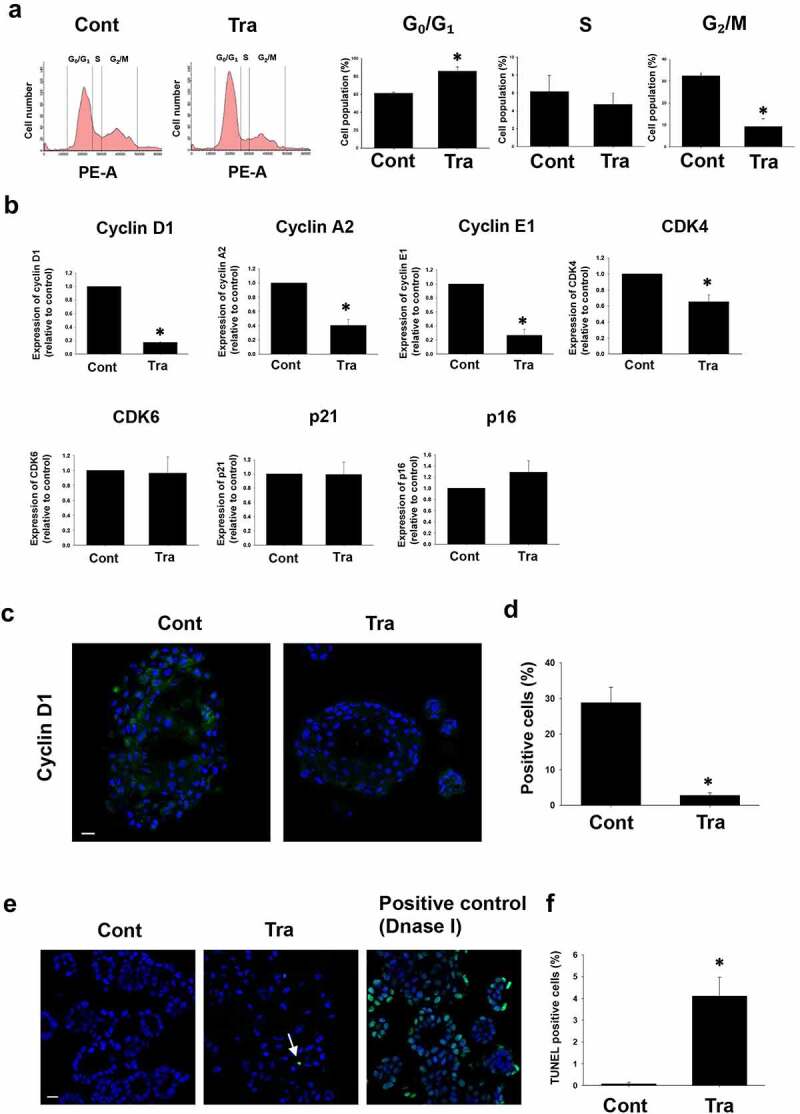
Effects of trametinib on cell cycle arrest and apoptosis in BC organoids. After BC cells were treated with trametinib (1 μM for 24 h), they were stained with propidium iodide (PI). Distribution of cell cycle phases (G0/G1, S, and G2/M) of BC organoid cells was analyzed by flow cytometry (a). The population of G0/G1, S and G2/M phases in BC organoids was expressed as mean ± S.E.M (n = 4). ﹡P < .05 vs. control. Effects of trametinib on expression of cell cycle-related genes in BC organoids (b). Expression of cyclin D1, cyclin A2, cyclin E1, CDK4, CDK6, p21, and p16 mRNA was determined by quantitative real-time PCR. Expression level of each gene was quantified based on the ration of expression level to GAPDH and shown as fold increase relative to control (n = 4). Results were expressed as mean ± S.E.M. ﹡P < .05 vs. control. Expression of cyclin D1 in trametinib-treated BC organoids. Representative photomicrographs were shown (n = 3). Scale bar: 50 μm (c). Expression level was quantified by counting the cyclin D1-positive cells (d, n = 3). Results were expressed as mean ± S.E.M. ﹡P < .05 vs. control. Effects of trametinib on apoptosis in BC organoids (e). After BC cells were treated with trametinib (1 μM for 72 h), they were stained with terminal deoxynucleotidyl transferase dUTP nick end labeling (TUNEL). DNase-treated organoid cells were used as the positive control (n = 3). The green fluorescence area indicates apoptotic-positive organoids cells and the blue DAPI staining shows intact DNA. The white arrows indicate apoptotic-positive cells. Scale bar: 50 μm. Quantification of apoptosis in trametinib-treated and non-treated cells was analyzed by ImageJ software (F, n = 3). Results were expressed as mean ± S.E.M. ﹡P < .05 vs. control
