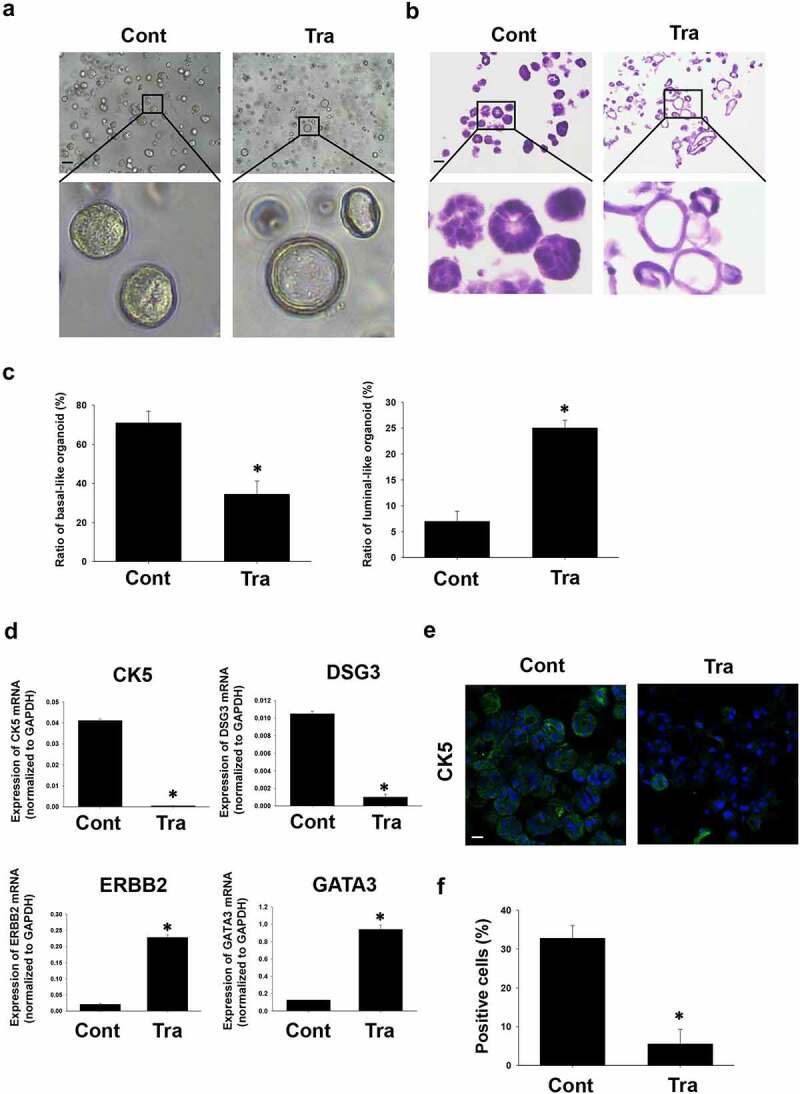
Figure 4.

Effects of trametinib on morphologic/phenotypic plasticity of BC organoids. Representative bright-field images (a) and H&E staining (b) of the differentiated BC organoids compared with control ones after trametinib (1 μM) treatment for 72 h. Scale bar: 500 μm. The enlarged images were shown below for each image. The ratio of basal-like and luminal-like organoids was quantified by using ImageJ software (c, n = 4). Effects of trametinib on expression of basal and luminal marker genes in BC organoids (d). mRNA expression of basal cell markers, CK5 and DSG3 and luminal cell ones, ERBB2 and GATA3 was determined by quantitative real-time PCR. Expression level of each gene was quantified based on the ration of expression level to GAPDH (n = 4). Results were expressed as mean ± S.E.M.﹡P < .05 vs. control. Expression of CK5 in trametinib-treated BC organoids. Representative photomicrographs were shown (e). The white arrows indicate apoptotic-positive cells. Scale bar: 50 μm. Expression level was quantified by counting the CK5-positive cells (F, n = 3). Results were expressed as mean ± S.E.M. ﹡P < .05 vs. control
