
Figure 3.
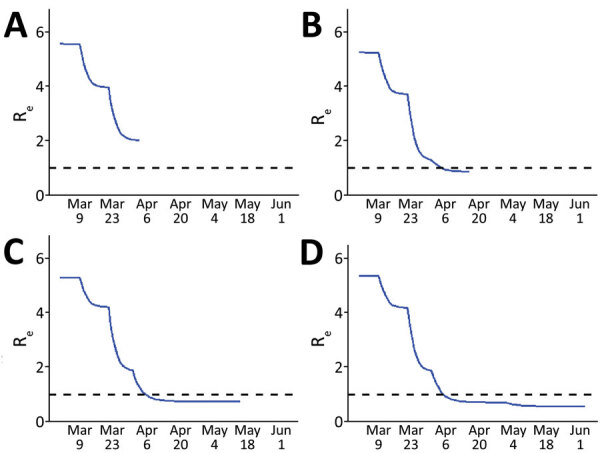
Estimated Re over time, Colorado, USA 2020, based on susceptible-exposed-infected-recovered models fit to data at 4 time points in the early months of the epidemic. The reproductive number was estimated from model output at the time of each fit. A) Fit 1 on April 3; B) fit 2 on April 16; C) fit 3 on May 15; D) fit 4 on June 16. Dashed lines indicate an Re of 1, below which the rate of new infections decreases and above which the rate of new infections increases. Re, effective reproductive number.