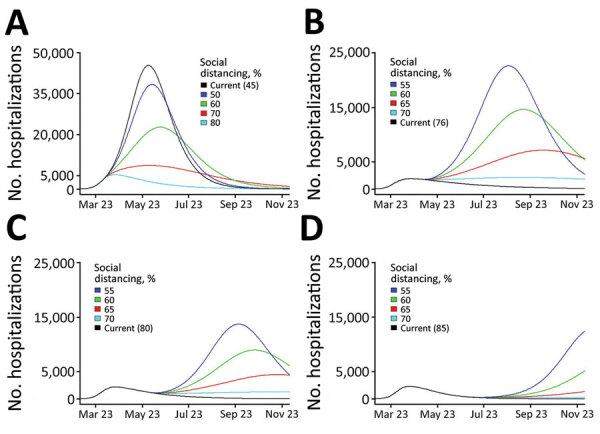
Figure 4.

Projected coronavirus disease hospitalizations, Colorado, USA, 2020, if current trajectory continued (black line) and for a range of social distancing scenarios (colored lines) generated by models calibrated at 4 time points during April‒June (fit 1: Apr 3; fit 2: April 16; fit 3: May 15; fit 4: June 16). Current trajectory was based on estimated parameters generated for each fit. Social distancing is modeled as a percent reduction in the contact rate (from baseline), and changes in social distancing are introduced 2 weeks after model fitting date. All other fitted parameters are held at the estimated values for each fit. Because peak hospitalization estimates from fit 1 were substantially higher than estimated for later fits, the y-axis is scaled to 50,000 as opposed to 25,000 for fits 2–4. Numbers in parentheses are current values.
