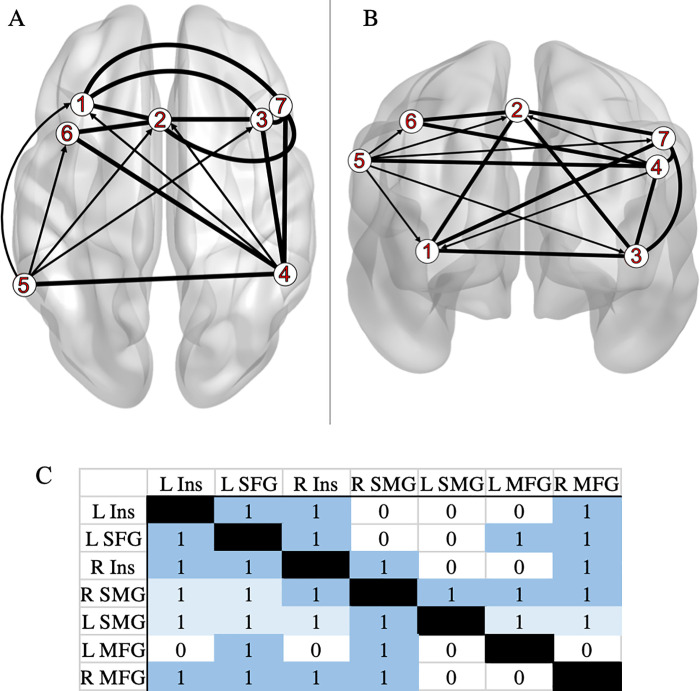
Fig 3. Meta-analytic model of connectivity between Deceptive > Honest peak regions.
A: horizontal slice and B: coronal slice. Data were visualized with the BrainNet Viewer [34] (http://www.nitrc.org/projects/bnv/). Key (ROI Labels): 1: left insula (L Ins); 2: left superior frontal gyrus (L SFG); 3: right insula (R Ins); 4: right supramarginal gyrus (R SMG); 5: left supramarginal gyrus (L SMG); 6: left medial frontal gyrus (L MFG); 7: right medial frontal gyrus (R MFG). (C) The matrix depicting connectivity from seed regions (left column) to the whole brain (“1” dark blue: bidirectional; “1” light blue: unidirectional; “0”: no direction implied). Each individual MACM (P value map) can be found on Neurovault (https://identifiers.org/neurovault.collection:10420).

