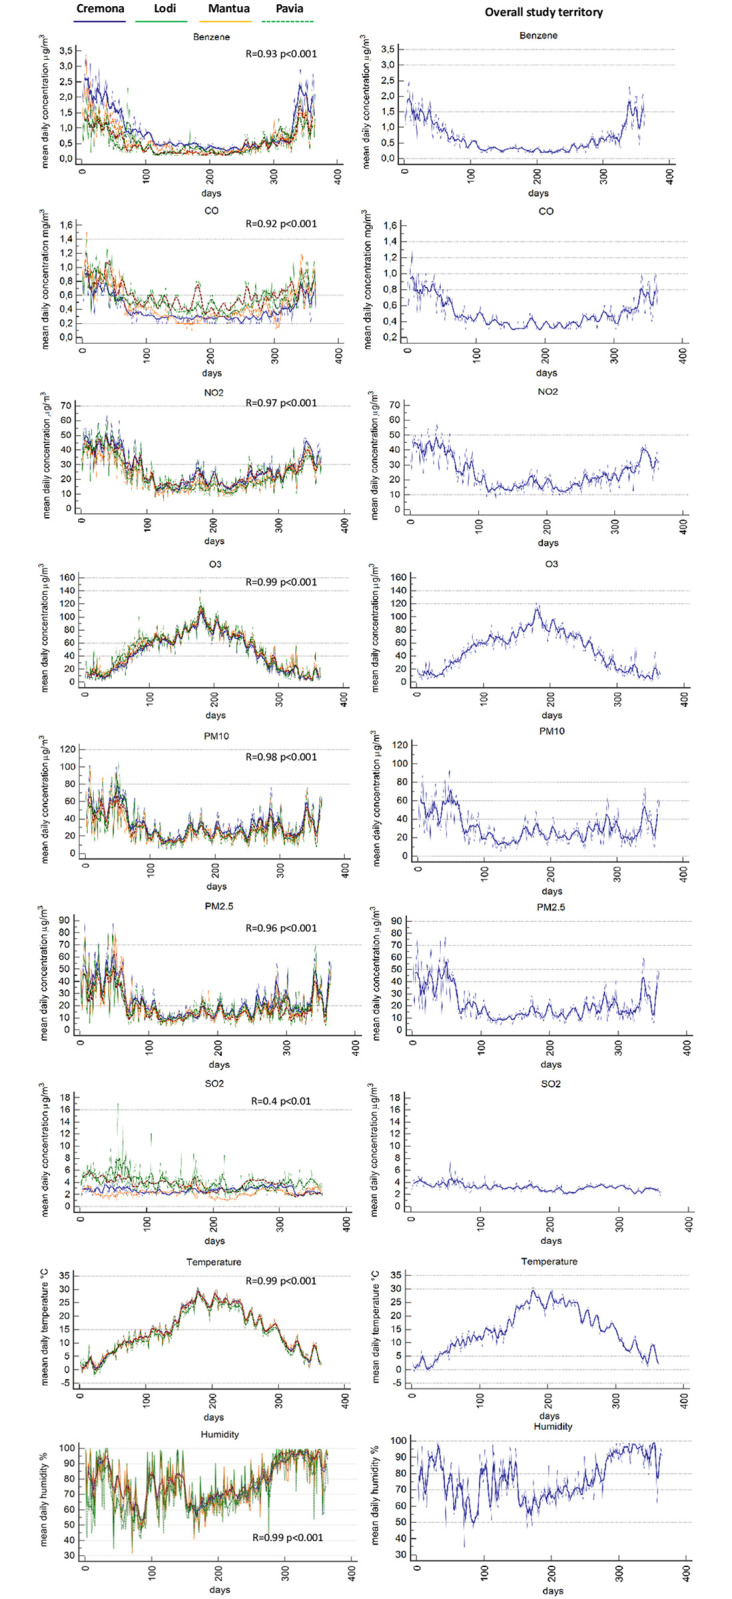
Fig 2. Panels and trends.

The left panels depict the daily trend combined with the seven-days mean trend of each pollutant for every province. In the right panels the daily trend combined with the seven-days mean of all the study territory are displayed. The R value is the multiple correlation coefficient, resulting from the multiple regression analysis and referred to the correlation between the different provinces. R value is provided for every pollutant.
