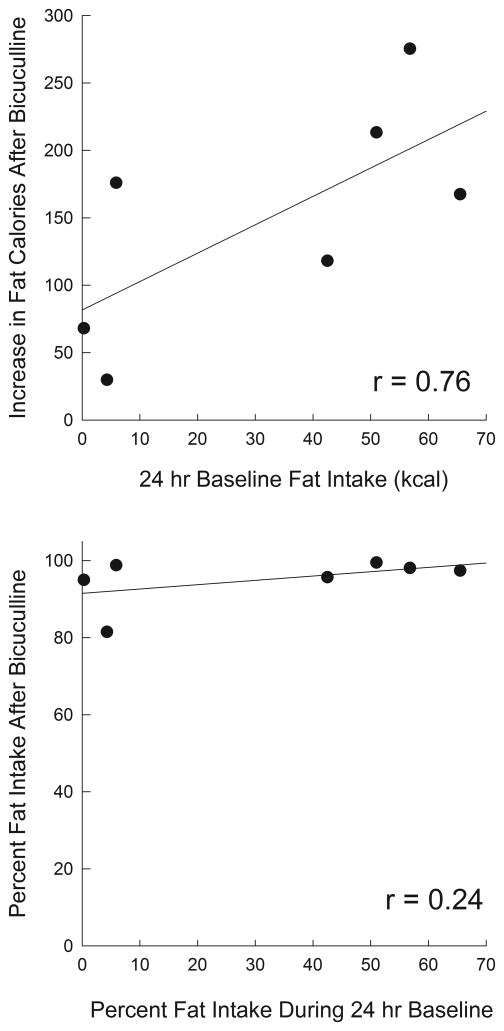
Figure 4.
Upper panel: Scatter plot and least squares regression line showing the relation between mean baseline caloric fat intake (abscissa) and the increase in absolute caloric intake of fat after bicuculline injections into the VPm, versus saline injections (ordinate). Lower panel: Scatter plot and least squares regression line showing the relation between the percent of caloric intake which consisted of fat during the 3 day baseline period (abscissa) and in the 60 min following bicuculline injections (ordinate). Pearson correlation coefficients are indicated on the figures.

