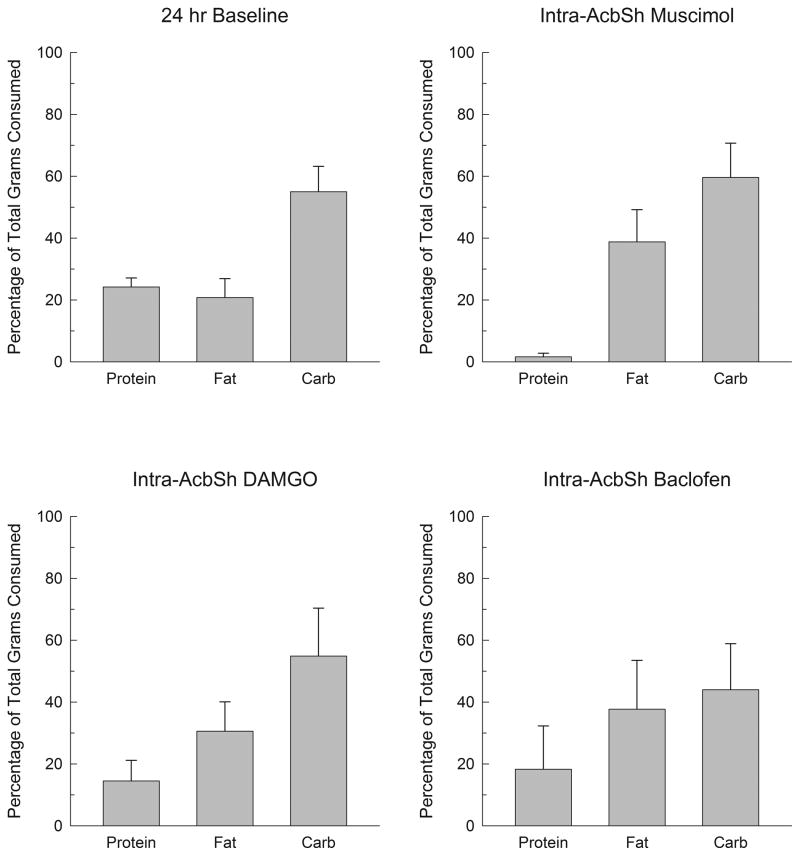
Figure 9.
Percentages of the total number of grams consumed that were taken from the protein, fat, and carbohydrate dietary components under several conditions in subjects with AcbSh cannulae. The upper left panel shows the distribution of baseline percentages averaged across the three days prior to the start of injections; the upper right panel shows percentages after muscimol (100 ng/side) injections in the AcbSh; the lower left panel after injections of DAMGO (125 ng/side) in the AcbSh; and the lower right panel after injections of baclofen (200 ng/side) into the AcbSh.

