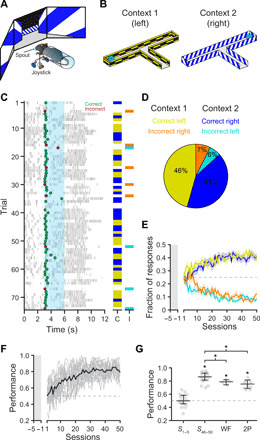
Fig. 1. A task for association of context with trajectory in the absence of locomotion.

(A) Schematic of behavioral setup. Mice use a rotary joystick to choose trajectories in a virtual T-maze presented on monitors spanning the horizontal visual field. (B) Schematic of the T-maze task for head-fixed mice in the absence of locomotion. Left turns are rewarded in context 1, whereas right turns are rewarded in context 2. (C) Example behavioral session. Dots indicate decisions (green = correct and red = incorrect); gray tick marks indicate licking; cyan shading indicates the decision window. Columns on the right show correct (C; yellow/blue) and incorrect (I; orange/cyan) responses in the two contexts. Trials in which no choice was made within the decision window are left blank. (D) Summary of the behavioral responses for the session shown in C (yellow = correct left, orange = incorrect right, blue = correct right, and cyan = incorrect left). (E) Fraction of response types during behavioral training (n = 18 mice). Mice are habituated to the training rig for 5 days (gray shaded area), during which the joystick can only rotate the correct direction to establish context-reward associations. Following habituation, the fraction of free decisions is progressively increased (10 to 80% of trials); only free decision trials are analyzed. Lines indicate mean ± SEM; colors as in (D). (F) Performance during behavioral training (n = 18 mice). Performance of individual mice is shown in gray. Average performance is shown in black. (G) Plots displaying performance during the first 5 days of training (S1–5), last 5 days of training (S46–50), widefield imaging sessions (WF), and two-photon imaging sessions (2P). Mouse performance was significantly above chance during late training and imaging sessions [S1–5 = 50.0%; S46–50 = 86.4%; WF = 78.9%; 2P = 75.5%; asterisks indicate lower 95% confidence interval (CI) > 50%]. Gray dots, individual mice; Black overlay, median ± 95% CI.
