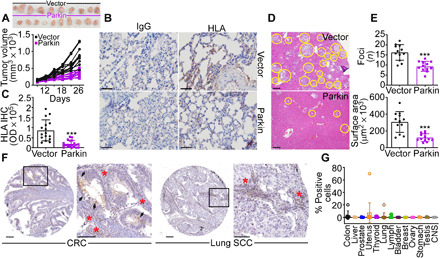
Fig. 2. Parkin inhibition of primary and metastatic tumor growth.

(A) PC3 cells stably transfected with vector or Parkin were injected subcutaneously on the flank of immunocompromised NOD SCID γ mice (two tumors per mouse; 10 tumors per group), and tumor volume was quantified with a caliper at the indicated time intervals. Top: Macroscopic images of tumors harvested from the two animal groups at the end of the experiment. (B and C) The conditions are as in (A), and lungs isolated from the indicated animal groups were stained with immunoglobulin G (IgG) or an antibody to human HLA by immunohistochemistry (IHC) [(B), representative images] and quantified (C). Scale bars, 100 μm. OD, optical density. ***P < 0.0001. (D) PC3 cells as in (A) were injected into the spleen of NOD SCID γ mice (five animals per group), and metastatic foci to the liver (yellow circles, representative images) were examined after 11 days by hematoxylin and eosin staining and light microscopy. Scale bars, 200 μm. (E) The conditions are as in (D), and the number (top) and surface area (bottom) of liver metastases were quantified by morphometry. Mean ± SD (N = 60). ***P < 0.0001. (F and G) A universal cancer TMA (Tissue Microarray) was stained with an antibody to Parkin by IHC [(F), representative images], and the percentage of positive cells in each tumor sample was quantified (G). Each symbol corresponds to an individual tumor sample. Scale bars, 100 μm. Inset, magnification of indicated areas. Arrowheads and red asterisks indicate tumor cells or infiltrating lymphocytes, respectively, positive for Parkin. CNS, central nervous system; CRC, colorectal cancer; SCC, squamous cell carcinoma.
