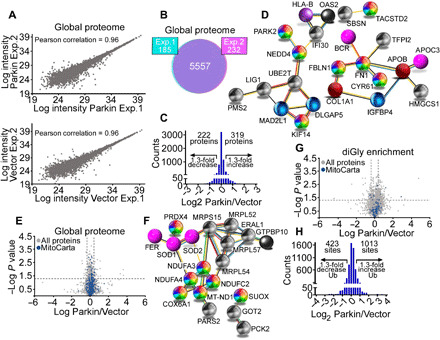
Fig. 3. Landscape of a Parkin proteome and ubiquitome in cancer.

(A) Scatter plots of protein intensities from two independent global proteome SILAC experiments in PC3 cells transfected with vector (light labeled) or Parkin (heavy labeled) in the absence of mitochondrial uncouplers. A Pearson correlation coefficient is indicated. (B) The conditions are as in (A), and concordance in detection of proteins between experiment 1 (Exp. 1, 97%) and experiment 2 (Exp. 2, 96%) is shown. (C) Changes in protein levels in PC3 cells transfected with Parkin. A 1.3-fold difference cutoff was defined as potentially biologically important. (D) STRING (Search Tool for the Retrieval of Interacting Genes/Proteins) analysis of predicted protein networks modulated by Parkin in the global proteome of PC3 cells. (E) Volcano plot of the Parkin global proteome in PC3 cells. The distribution of total proteins (N = 5557) and MitoCarta 3.0–associated proteins (N = 741) is indicated. (F) STRING analysis of predicted mitochondrial protein networks modulated by Parkin in the global proteome. (G) Volcano plot of a Parkin ubiquitome in PC3 cells in the absence of mitochondrial uncouplers. The distribution of total (N = 3796) and MitoCarta 3.0–associated ubiquitination sites (N = 112) is indicated. (H) Changes in Parkin ubiquitome identified using SILAC-based ubiquitin remnant motif enrichment (K-ε-GG), with 1013 and 423 sites showing increased or decreased ubiquitination in the presence of Parkin using a 1.3-fold cutoff.
