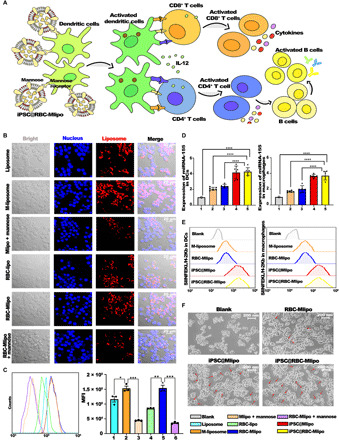
Fig. 2. iPSC@RBC-Mlipo target and stimulate APC maturation and differentiation.

(A) Schematic of immune-stimulating effect of iPSC@RBC-Mlipo by targeting DCs and stimulating their differentiation. IL-12, interleukin-12. (B) Confocal laser scanning microscopy images of macrophages treated respectively. Blue for Hoechst labeled macrophage nucleus; Red for rhodamine-labeled liposome. Scale bars, 20 μm. (C) Flow cytometric analysis of cellular uptake of nanoparticles and the quantified intracellular fluorescence uptake level calculation. 1, liposome; 2, M-liposome; 3, Mlipo + mannose; 4, RBC-lipo; 5, RBC-Mlipo; and 6, RBC-Mlipo + mannose. MFI, mean fluorescence intensity. (D) Using SYBR Green quantitative polymerase chain reaction to analyze the expression quantity of miRNA-155 in DCs and macrophages to show differentiation degree. 1, blank; 2, M-liposome; 3, RBC-Mlipo; 4, iPSC@Mlipo; and 5, iPSC@RBC-Mlipo. (E) Antigen cross-presentation in DC2.4 cells and macrophages coincubated with groups. 1, blank; 2, M-liposome; 3, RBC-Mlipo; 4, iPSC@Mlipo; and 5, iPSC@RBC-Mlipo. (F) Morphological changes of macrophages before and after nanoparticles were treated. The red arrow points to the differentiated macrophages. Scale bars, 200 nm. Data were expressed as means ± SEM. Statistical significance was calculated by one-way analysis of variance (ANOVA) with Tukey’s post hoc test. *P < 0.05, **P < 0.01, ***P < 0.005, and ****P < 0.001.
