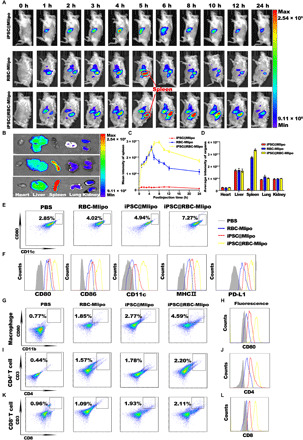
Fig. 3. Biodistribution and immune-stimulating ability of iPSC@RBC-Mlipo in vivo.

(A) Fluorescence imaging of ICR mice for hours after intravenous injection of group 1 iPSC@Mlipo, group 2 RBC-Mlipo, and group 3 iPSC@RBC-Mlipo. The fluorescent signal is expressed in the form of radiant efficiency. (B) Fluorescence imaging of dissected organs 6 hours after intravenous injection. (C) Mean fluorescence intensity of the spleen at different time points in vivo after treatment with three groups. (D) Average fluorescence intensity of dissected organs 6 hours after intravenous injection. (E) Flow cytometric analysis of activated splenic DCs 12 hours after treatment with groups. (F) Fluorescence of various maturation markers expressed on the surface of splenic DCs 12 hours after treatment with groups. Flow cytometric analysis of activated macrophages (G), CD4+ T cells (I), and CD8+ T cells (K). (H, J, and L) Fluorescence of various activation markers expressed on splenic immune cells 12 hours after intravenous injection of groups. Data were expressed as means ± SEM. Statistical significance was calculated by one-way ANOVA with Tukey’s post hoc test.
