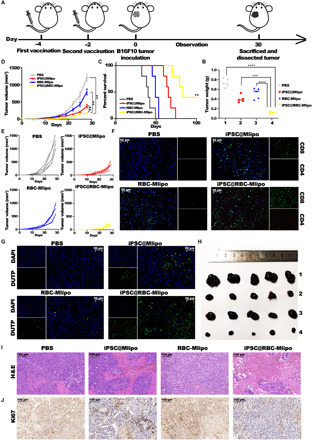
Fig. 4. Preventive antitumor effect of the nanovaccine iPSC@RBC-Mlipo.

(A) Schematic illustration of setting a B16F10 tumor model after vaccinating different groups twice. (B) Dissected tumors weights in groups. (C) Survival curves, (D) average tumor volume curves, and (E) individual tumor growth kinetics in different groups (n ≥ 5). (F) Immunofluorescence images of tumor slides to present CD4+ T cells and CD8+ T cells infiltrating into the tumor tissues. Red for CD4 antibody, green for CD8 antibody, and blue for 4′,6-diamidino-2-phenylindole (DAPI)–labeled nucleus. Scale bars, 50 μm. (G) Fluorescence TUNEL analysis of apoptosis in the tumor sections after vaccinating different groups. Scale bars, 50 μm. (H) Dissected tumors in groups 1, PBS; 2, iPSC@Mlipo; 3, RBC-Mlipo; and 4, iPSC@RBC-Mlipo. (I) Images of H&E-stained and (J) Ki67-stained tumor slides after vaccinating different groups. Scale bars, 50 μm. Data were expressed as means ± SEM. Statistical significance was calculated by one-way ANOVA with Tukey’s post hoc test. **P < 0.01, ***P < 0.005, and ****P < 0.001.
