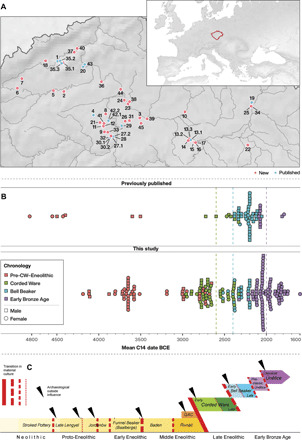
Fig. 1. Temporal and geographic distribution of studied Neolithic, Eneolithic, and EBA individuals from Bohemia.

(A) Map of Bohemia showing the locations of sampled sites (red, new; blue, previously published; table S2 and figs. S1 to S5). (B) Mean age of newly reported (n = 206) and published (n = 65) individuals from Bohemia. (C) Local chronology of archaeological cultures and time periods. Black triangles indicate external influences visible in the material culture. Red lines indicate qualitative degree of change in material culture.
