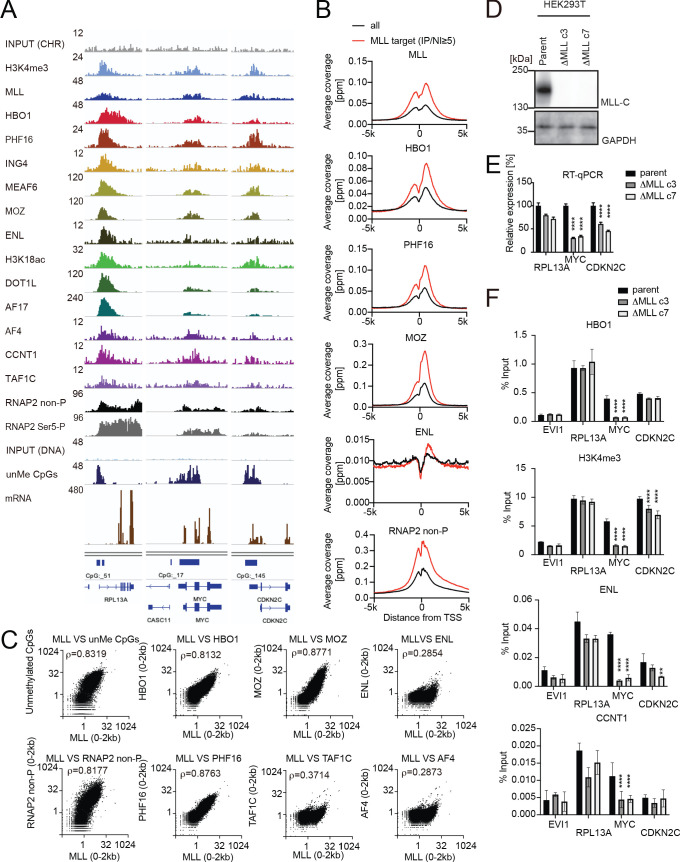
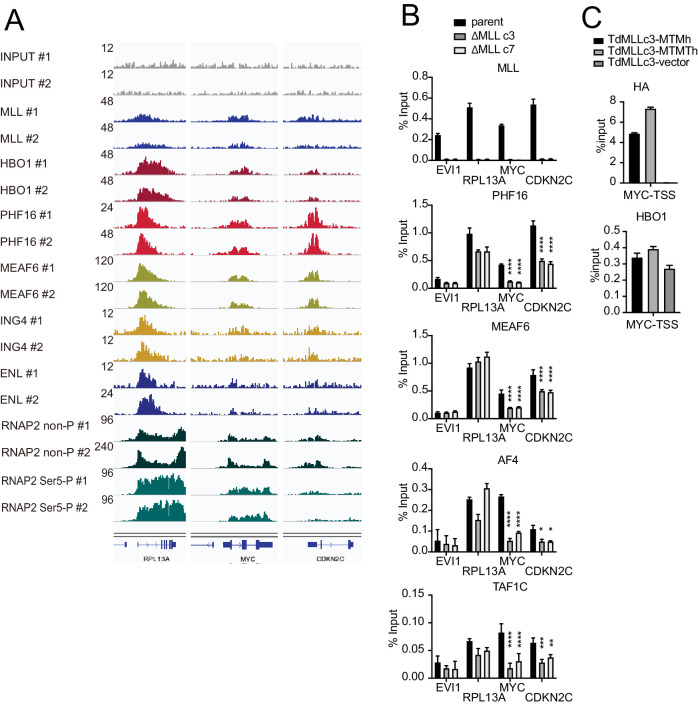
Figure 3. MLL recruits the HBO1 and AEP/SL1 complexes to promoters.
(A) Genomic localization of various transcriptional regulators/epigenetic marks in HEK293T cells. Chromatin immunoprecipitation (ChIP) followed by deep sequencing (ChIP-seq) analysis was performed on the chromatin of HEK293T cells for the indicated proteins/modifications. CIRA-seq data for unmethylated CpGs (unMe CpGs) and RNA-seq data are shown for comparison. (B) Average distribution of proteins near transcription start sites (TSSs) of HEK293T cells. Average ChIP signal distribution of indicated proteins at the MLL target genes (red) or all genes (black) is shown as in Figure 2E. (C) Relative occupation by multiple factors at all TSSs. ChIP-seq or CIRA-seq tags of indicated proteins at all genes were clustered into a 2 kb bin (0 to +2 kb from the TSS) and are presented as XY scatter plots. Spearman’s rank correlation coefficient (ρ) is shown. (D) Expression of MLL in MLL-deficient HEK293T cell lines. (E) Expression of MLL target genes in two independently generated MLL-deficient clones. Relative expression levels normalized to GAPDH are shown with error bars (mean ± SD of PCR triplicates) by RT-qPCR. Data are redundant with our previous report (Miyamoto et al., 2020). (F) Localization of MLL, the HBO1 complex, the AEP complex, and the SL1 complex in two independently generated MLL-deficient clones. ChIP-qPCR was performed for indicated genes using qPCR probes designed for the TSS of each gene. ChIP signals are expressed as the percent input with error bars (mean ± SD of biological triplicates). Statistical analysis was performed by ordinary two-way ANOVA comparing each sample with the parent cells. *p ≤ 0.05, **p ≤ 0.01, ***p ≤ 0.001, ****p ≤ 0.0001.


