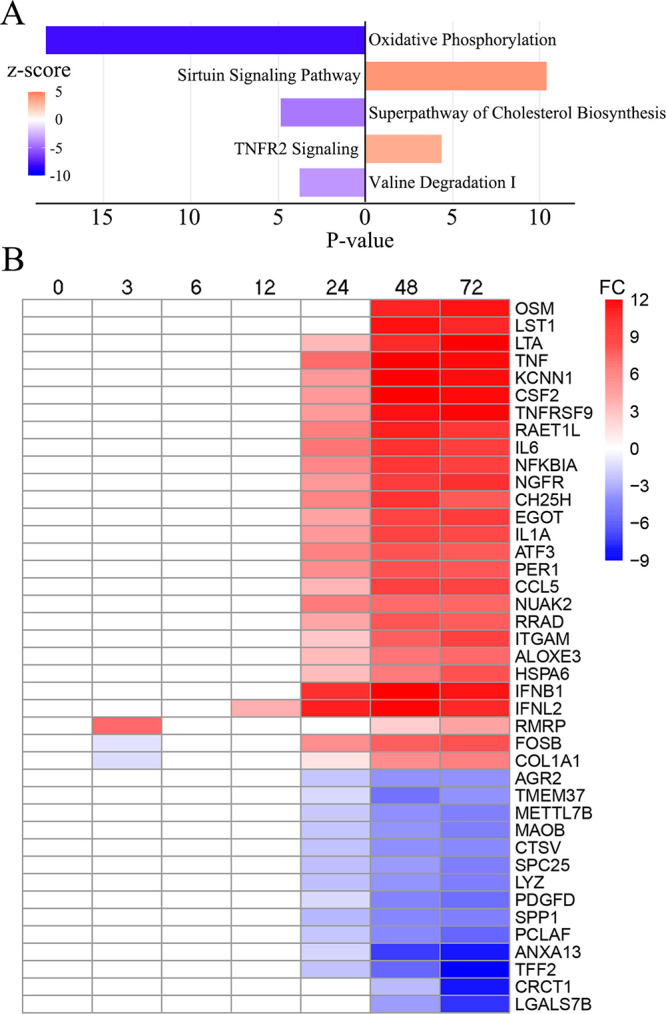
FIG 4.

Host transcriptome deviation over time after SARS-CoV-2 infection. (A) Dysregulated pathways enriched according to IPA. Activated and deactivated pathways at 72 hpi are indicated in orange and navy, respectively. Pathways with absolute –log10P values (P values) of less than 3 were removed. (B) Heatmap of the host transcriptome at 0 to 72 hpi. The genes showing the largest log2fold changes (FC) are demonstrated in red and navy.
