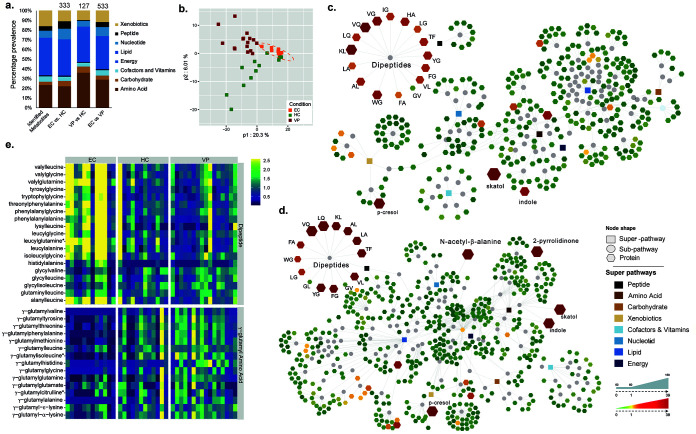
FIG 1.
Distinct metabolite profile in EC and enrichment of dipeptides. (a) Stacked bar plots with proportions of each superpathway based on the total number of detected and identified metabolites in all groups (825 metabolites), based on the number of metabolites with significantly different levels between EC and HC (P < 0.05, q = 0.053, 333 metabolites), EC and VP (P < 0.05, q = 0.012, 533 metabolites), and VP and HC (P < 0.05, q = 0.187, 127 metabolites). The differential metabolite analysis is given in Table S1. (b) PLS-DA based on all metabolites detected (n = 825) shows clustering of all EC together and separated from HC and VP. Presented data include samples from HC (n = 12, green), EC (n = 12, orange), and VP (n = 16, red). (c and d) Network of the metabolites that were significantly different between EC and the other two groups, VP and HC. Rectangular node shapes represent the eight superpathways that are shown in different colors according to the legend. Circles are used for subpathways belonging to the eight superpathways. Octagonal node shapes show the single metabolites, where a gradient was applied depending on fold change from 0.01 = green (decreased metabolite level), to 0 = yellow (nonsignificant), to a fold change from 4.8 to 39 = red. The sizes of the octagons indicate P values: the larger the size, the lower the P value. Lines connect each metabolite to its respective subpathway and subpathways to their respective superpathways. (c) EC versus VP (533 metabolites). (d) EC versus HC (333 metabolites). (e) Heat map representing levels of metabolites that are part of dipeptides (upper part) or γ-glutamyl amino acids (lower part). Samples are grouped according to study group (EC, HC, and VP). Color depicts increasing log2 (1 + x) levels from blue via green to yellow. The data shown include samples of HC (n = 12), EC (n = 12), and VP (n = 16).

