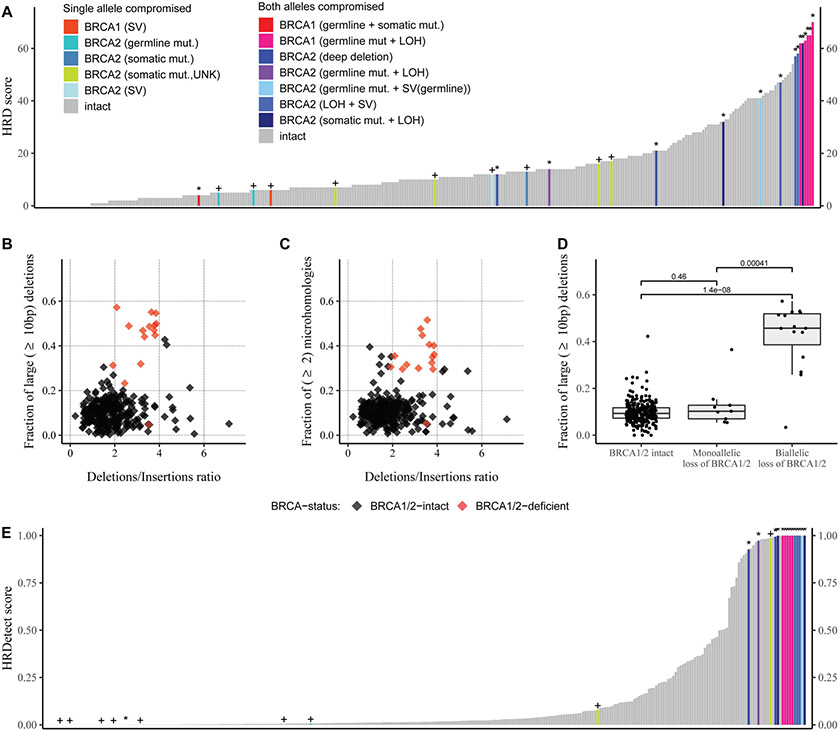
Figure 1: Summary of the HRD-related predictors in the whole genome datasets.
A: HRD score: the sum of the three allele-specific CNV-derived genomic scars (HRD-LOH + LST + ntAI)
B: Fraction of larger than 9 bp deletions versus deletions/insertions ratio
C: Fraction of microhomology-mediated deletions with larger or equal to 10 bp in length versus deletions/insertions ratio
D: Fraction of at least 10 bp long deletions in the BRCA1/2 intact and deficient patients, the groups were compared with Mann-Whitney U-test, the p-values are represented on the plots.
E: HRDetect, the “+” signs if one allele is compromised, the “*” represent homozygous loss of BRCA1/2

