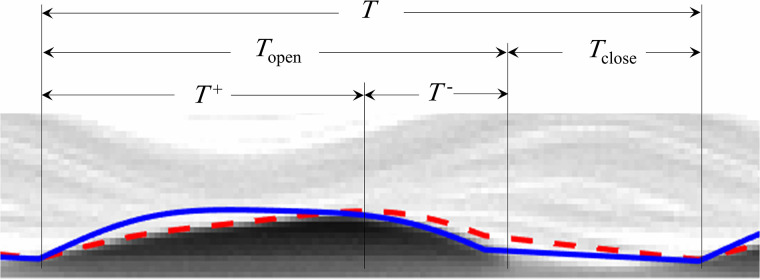
FIG. 5.
(Color online) The kymogram at the mid anterior-posterior location of the VF model. The solid and dashed lines identify the sinusoidal functions that were respectively fitted to the inferior edge of the VF during closing and the superior edge during opening via the least-squares regression (Ref. 65).

