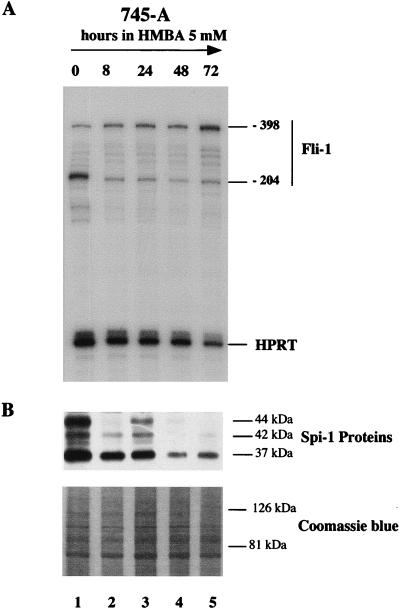
FIG. 6.
Kinetic analysis of Fli-1 transcript and Spi-1/PU.1 protein levels in HMBA-treated 745-A cells. (A) RNase protection assay using a mixture of the antisense Fli-1 RNA probe 3 (−262/+52) and the antisense RNA probe HPRT. The protected fragments corresponding to the major Fli-1 transcripts initiated at positions −204 and −398 as well as the HPRT transcript are indicated on the right. (B) Western blot analysis of Spi-1/PU.1 proteins. The positions of major protein bands (determined by comparison with molecular weight standards [not shown]) are indicated on the right. The time of HMBA (5 mM) treatment is indicated at the top. A photograph of the upper part of the gel stained by Coomassie blue is shown (bottom) as a control for equal loading of protein samples.

