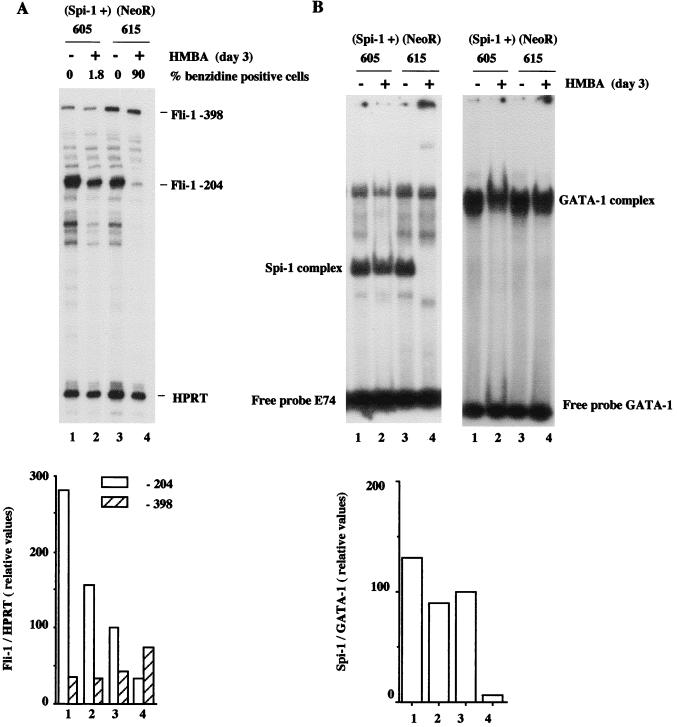
FIG. 7.
Quantitative analysis of −204 and −398 Fli-1 transcripts and Spi-1/PU.1 DNA binding activity in Spi-1/PU.1-overexpressing DS19/605 (lanes 1 and 2) and control DS19/615 (lanes 3 and 4) cells treated (lanes 2 and 4) or not treated (lanes 1 and 3) for 3 days with 5 mM HMBA. (A) Top, autoradiogram of gel with protected Fli-1 and HPRT fragments (internal control) detected by RNase protection assay using antisense Fli-1 RNA probe 3 (−262/+52) and antisense HPRT probe. Fli-1 and HPRT transcripts corresponding to detected protected fragments are indicated on the right. Bottom, quantitation of −204 and −398 Fli-1 transcripts. The signals corresponding to −204, −398 Fli-1, and HPRT transcripts were quantified by phosphorimager analysis. The relative abundance of −204 Fli-1 transcripts (to HPRT transcripts) in untreated control DS19/615 cells was arbitrarily chosen as 100. (B) Top left, EMSA of Spi-1/PU.1 DNA binding activity, using labeled E74 probe and equal amounts of protein nuclear extracts prepared from the indicated cells. The position of Spi-1/PU.1 complex, identified by Spi-1/PU.1 antiserum (Fig. 11D), is indicated on the right. Top right, EMSA of GATA-1 DNA binding activity, using labeled GATA-1 probe and equal amounts of protein nuclear extracts prepared from the indicated cells. The position of the GATA-1 complex is indicated on the right. Bottom, the signals corresponding to Spi-1/PU.1 and GATA-1 complexes were quantified by phosphorimager analysis. The relative abundances of Spi-1/PU.1 complexes, standardized to the corresponding abundances of GATA-1 complexes, are reported as percentages of the Spi-1/GATA-1 ratio determined for untreated control DS19/615 cells, taken as 100%.

