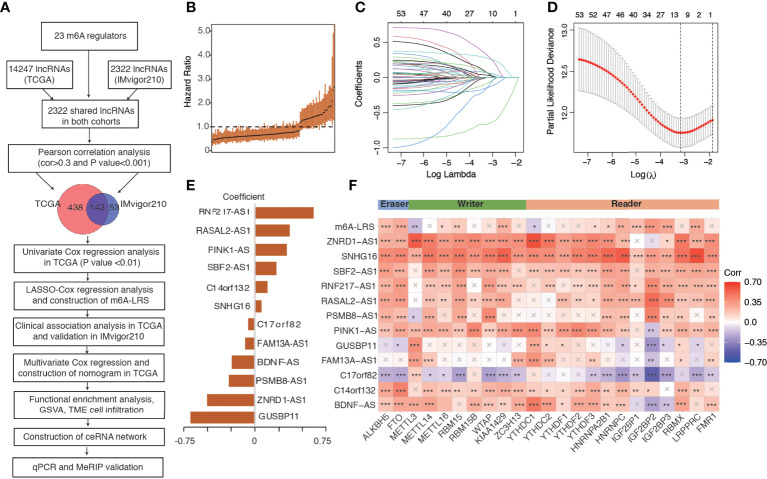
Figure 1.
Study flowchart and construction of the m6A-related lncRNA risk score. (A) Study flowchart. (B) The hazard ratio of the 143 m6A-related lncRNAs for overall survival in the TCGA cohort. Error bars indicate 95% confidence intervals. (C, D) Least absolute shrinkage and selection operator (LASSO) regression model. (E) Coefficients of the LASSO-Cox model with the minimum lambda criteria. (F) Heatmap of the correlations between m6A regulators, 12 prognostic m6A-related lncRNAs, and the corresponding risk score. An “X” indicates a non-significant correlation (P > 0.05), *P < 0.05, **P < 0.01, ***P < 0.001. m6A-LRS: m6A-related lncRNA risk score.

