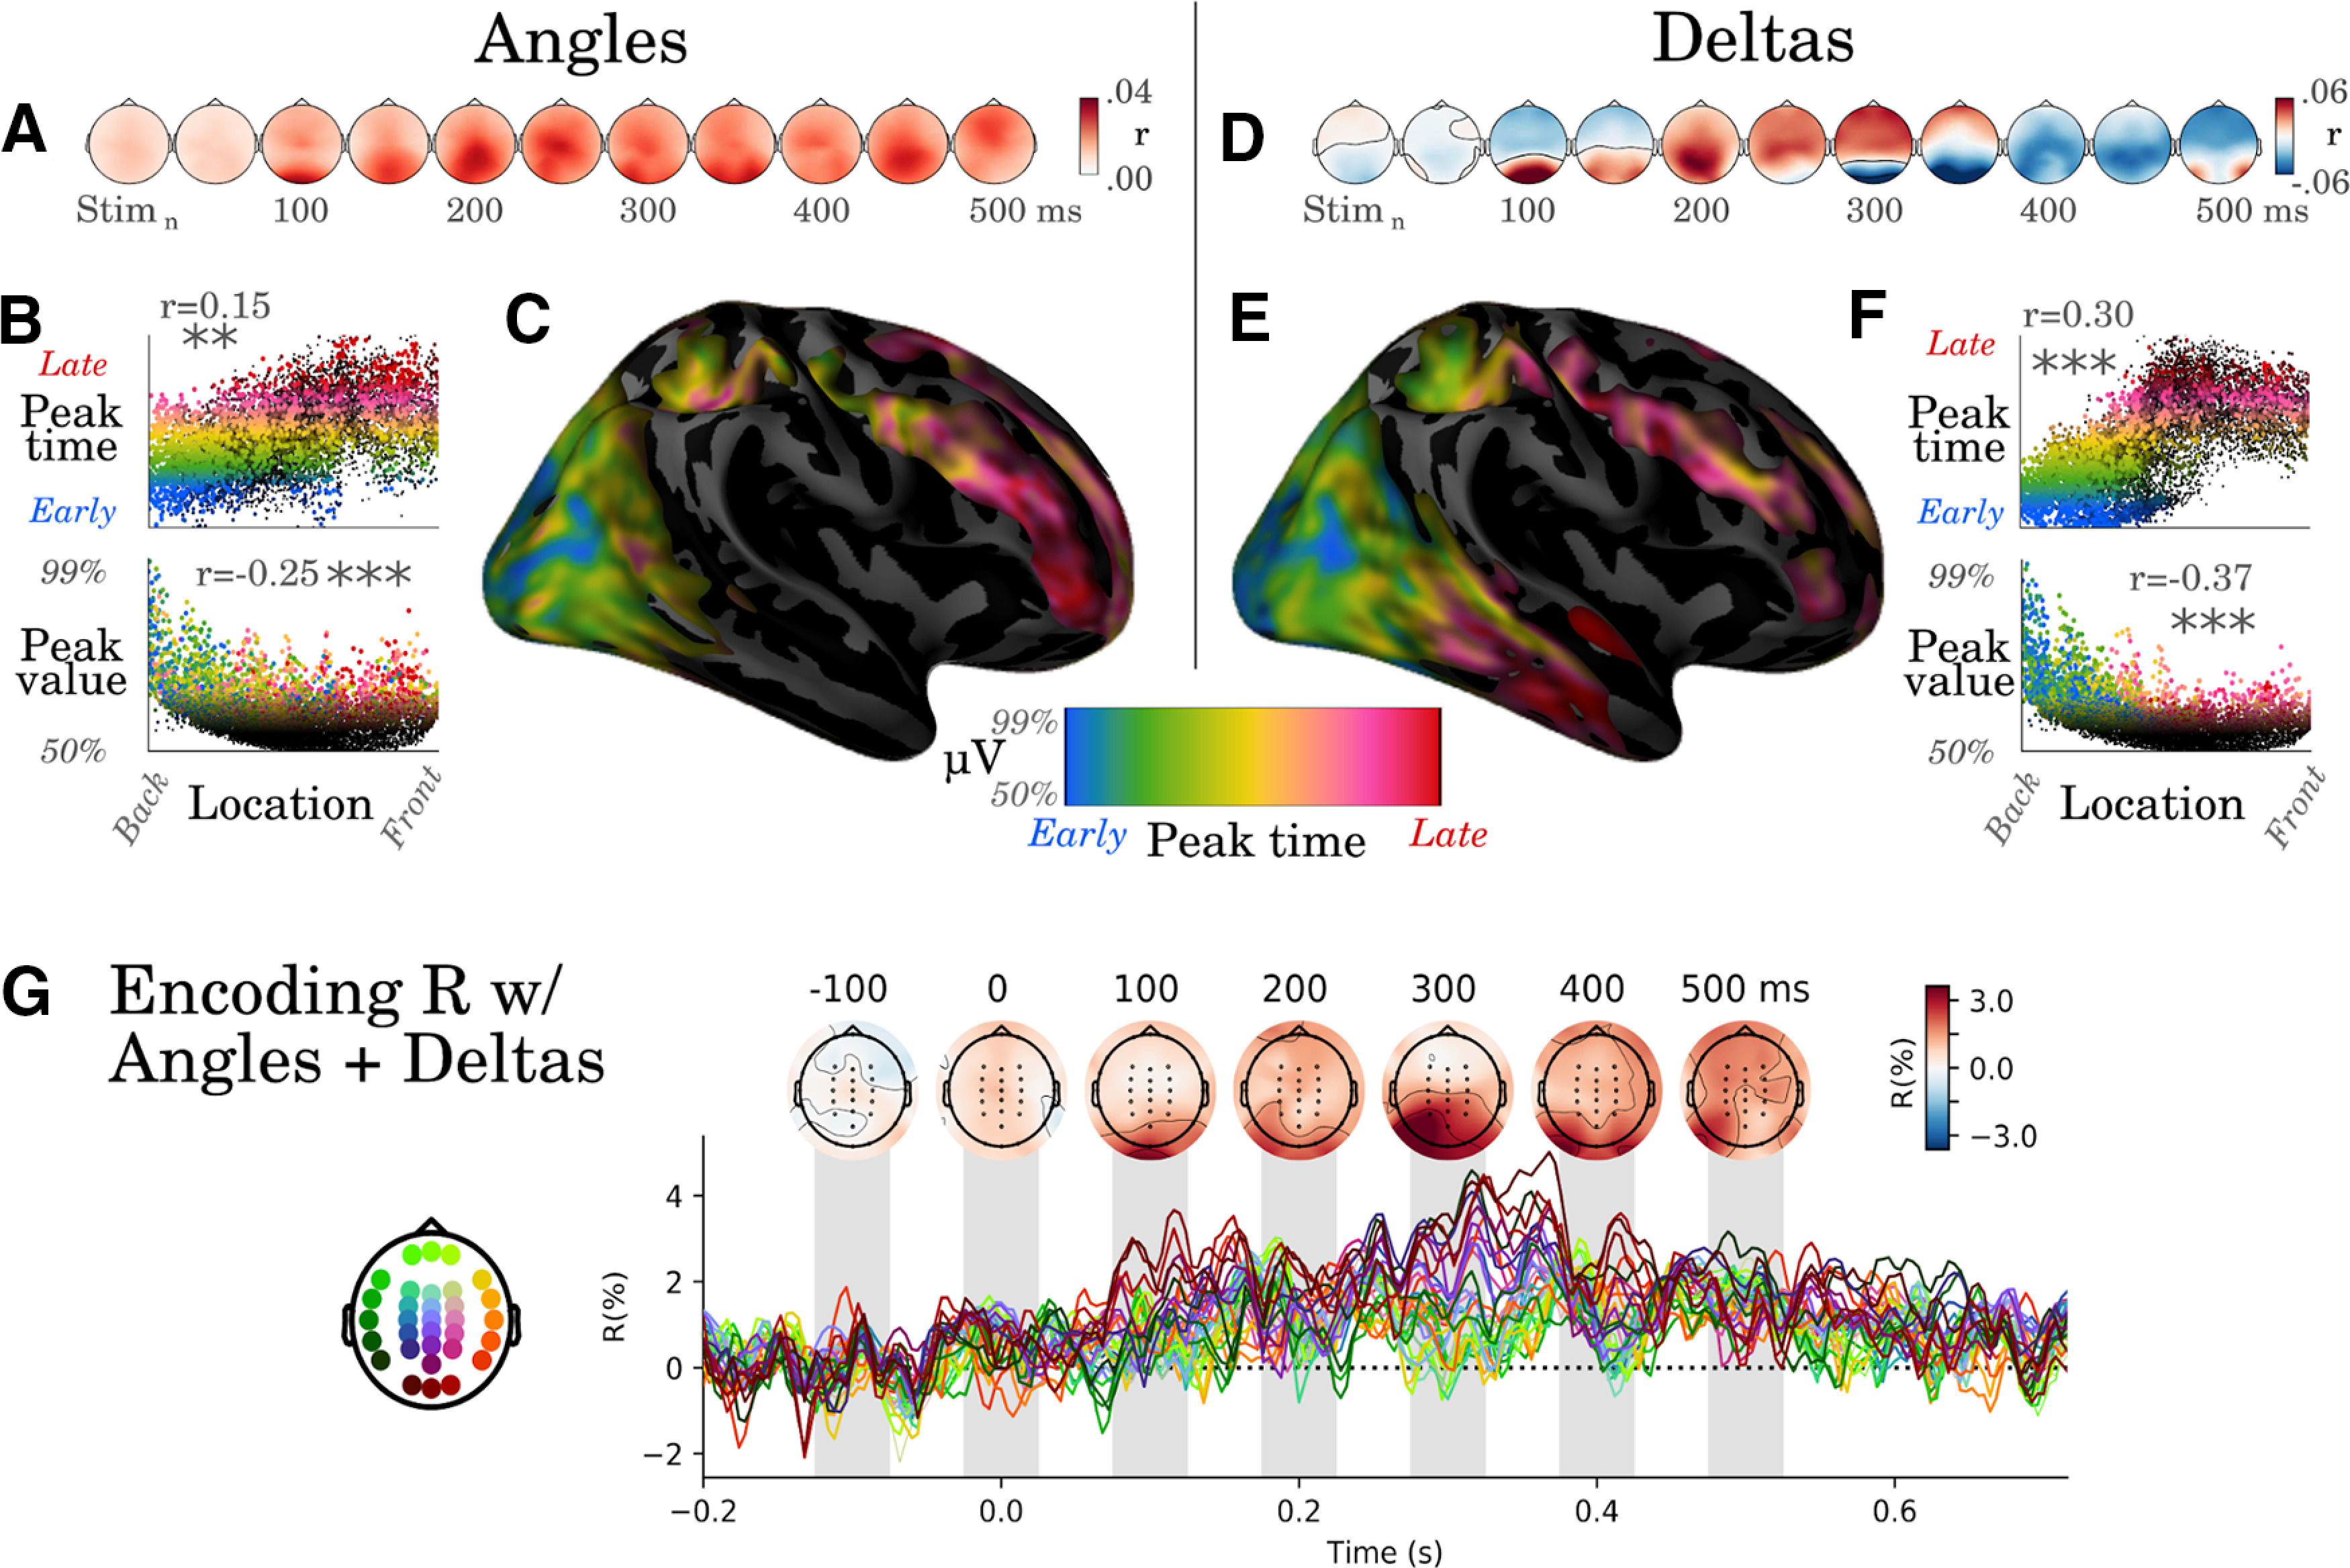
Figure 2.

Visual representations propagate from sensory to associative cortices. A, Correlation scores resulting from encoding analyses, trained to predict the EEG activity from the sine and cosine of the stimulus angles. B, Each dot corresponds to a source estimated from the EEG coding topographies with a minimum norm estimation. The x-axis corresponds to the source location along the posteroanterior direction. Top, The y-axis either indicates the relative timing of the peak activity in each source or Bottom, The intensity of this peak. Asterisks indicate statistical significance (**p < 0.01, ***p < 0.001) C, Same data as B but plotted on the cortical surface. Colors indicate both the peak amplitude (e.g., black: amplitude = median amplitude across sources) and the peak latency (e.g., blue: peak within analogous to the 5% percentile of the earliest responses across sources; red: peak beyond 95% percentile). D, Correlation coefficients between deltas and EEG amplitude. E, F, Analogous analyses tp B-C applied to the brain responses coding for the changes between successive stimuli (δ). G, Cross-validated encoding scores (Pearson's r) obtained with both angles (sin + cos) and deltas. Colors indicate EEG channels. The results can be visualized interactively at https://kingjr.github.io/chronicles/.
