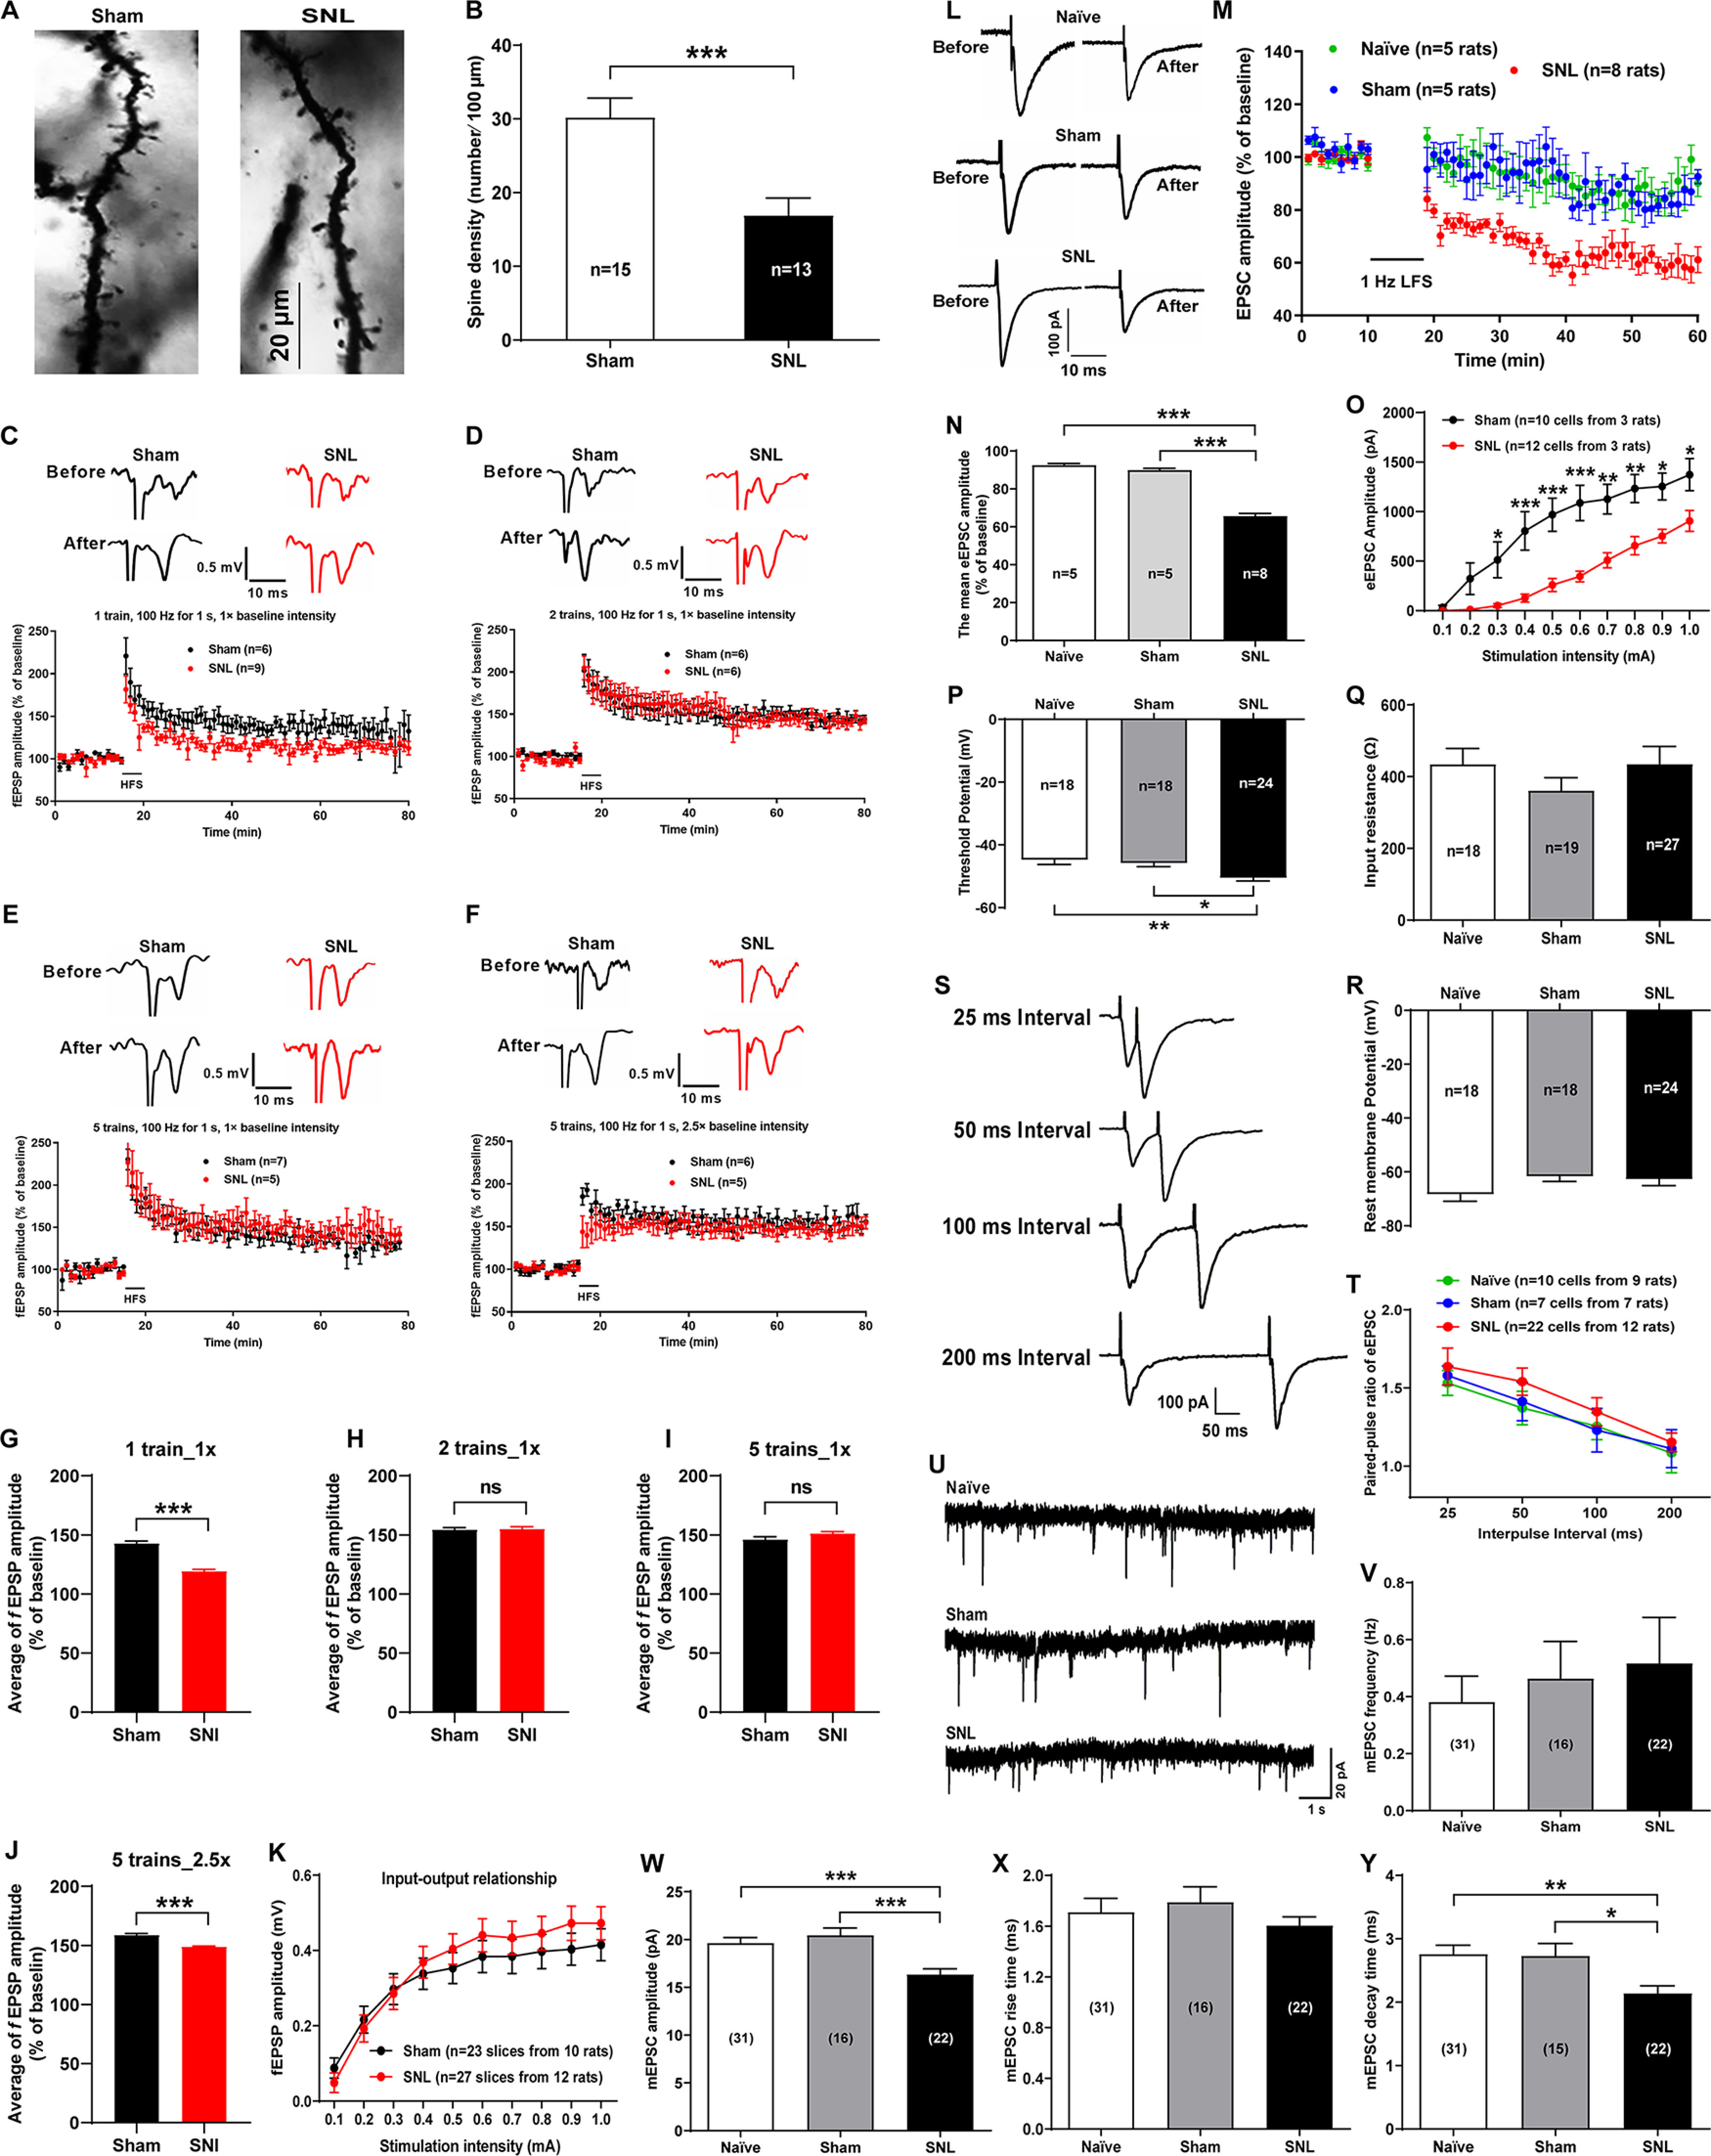
Figure 2.

Alterations of spine density, basal synaptic properties of CeA neurons, and LTD at the LA/BLA-CeA synapse of SNL-operated rats. A, B, Morphologic plasticity of the CeA neurons in sham- and SNL-operated rats. A, Representative images of Golgi-Cox–stained dendritic spines in the CeA neurons of sham- (left) and SNL-operated (right) rats. Scale bar, 20 μm. B, Summary plot of dendritic spine density expressed as the spine numbers per 100 μm dendrite length (n = 13-15 neurons from 5 rats per group, t(26) = 3.74, p = 0.009 vs sham, two-tailed unpaired Student's t test). C–J, LTP of fEPSPs at the LA/BLA-CeA synapse recorded from the amygdaloid slices of sham- and SNL-operated rats. C–F, LTP induced by different protocols of a conditioning HFS, including 1 train, 1× baseline intensity, 100 Hz for 1 s, at 30 s intervals (C); 2 trains, 1× baseline intensity, 100 Hz for 1 s, at 30 s intervals (D); 5 trains, 1× baseline intensity, 100 Hz for 1 s, at 30 s intervals (E); and 5 trains, 2.5× baseline intensity, 100 Hz for 1 s, at 30 s intervals (F). Histograms represent the mean time course of fEPSPs before and after HFS in sham and SNL groups. Top, Traces are representative fEPSPs recorded at 10 min before and 60 min after HFS of the LA/BLA. Calibration: 0.5 mV, 10 ms. G–J, Bar graph represents the mean amplitude of fEPSPs (% of baseline) during the 20-80 min following HFS. ***p < 0.001; ns, no statistical difference, compared between the SNL and the sham SNL groups (two-tailed unpaired Student's t test). K, Input-output relationship of fEPSP amplitude between the SNL and the sham SNL groups measured by increasing the stimulus intensity from 0.1 to 1.0 mA in 0.1 mA increment (n = 23-27 slices from 10-12 rats, F(9,480) = 0.43, p > 0.05 compared between the SNL and the sham SNL groups, two-way ANOVA with Sidak's post hoc test). L–N, LTD of eEPSCs at the LA/BLA-CeA synapse in sham- and SNL-operated rats. L, Representative traces of eEPSCs before and after LFS. Calibration: 100 pA, 10 ms. M, Average eEPSC amplitudes (normalized to baseline) over the time course of the LFS protocol (480 pulses at 1 Hz with postsynaptic cell depolarized to −50 mV). N, Average eEPSC amplitudes (normalized to baseline) are plotted during the 20-60 min following LFS (n = 5-8 rats per group, F(2,161) = 177.8, p < 0.0001 vs naïve and sham, one-way ANOVA with Tukey's post hoc test). O, Input-output relationship of eEPSCs at the LA/BAL-CeA synapse in sham- and SNL-operated rats. *p < 0.05, **p < 0.01, ***p < 0.001, SNL versus sham, n = 10-12 cells, F(9,200) = 1.83 (two-way ANOVA with Sidak's post hoc test). P–R, The intrinsic properties of CeA neurons, including threshold potential (P), input resistance (Q), and resting membrane potentials (R) in naïve, sham-, and SNL-operated rats. *p < 0.05, **p < 0.01, versus naïve and sham (one-way ANOVA with Tukey's post hoc test). S, T, PPR of eEPSCs evoked by a pair of electrical pulses (100 μs duration) with IPIs of 25, 50, 100, or 200 ms to the LA/BLA-CeA pathway, given every 30 s. S, Representative paired-pulse traces of eEPSCs recorded from a CeA pyramidal cell in response to paired-pulse stimuli at different IPIs as indicated. Calibration: 100 pA, 50 ms. T, Summary plot for PPR of eEPSCs against IPIs in naïve, sham-, and SNL-operated rats (n = 7–22 cells from 7–12 rats per group, F(6,138) = 0.06, p > 0.05 versus sham, two-way ANOVA with Sidak's post hoc test). U–Y, mEPSCs recorded in the CeA neurons in naïve, sham-, and SNL-operated rats. U, Representative traces of mEPSCs in naïve, sham-, and SNL-operated rats. Calibration: 20 pA, 1 s. V–Y, Summary plots for mean frequency (V), amplitude (W), rise time (X), and decay time (Y) of mEPSCs measured in naïve, sham-, and SNL-operated rats, respectively (n = 15-31 cells from 12–15 rats per group). *p < 0.05, **p < 0.01, ***p < 0.001, versus naïve and sham (one-way ANOVA with Tukey's post hoc test).
