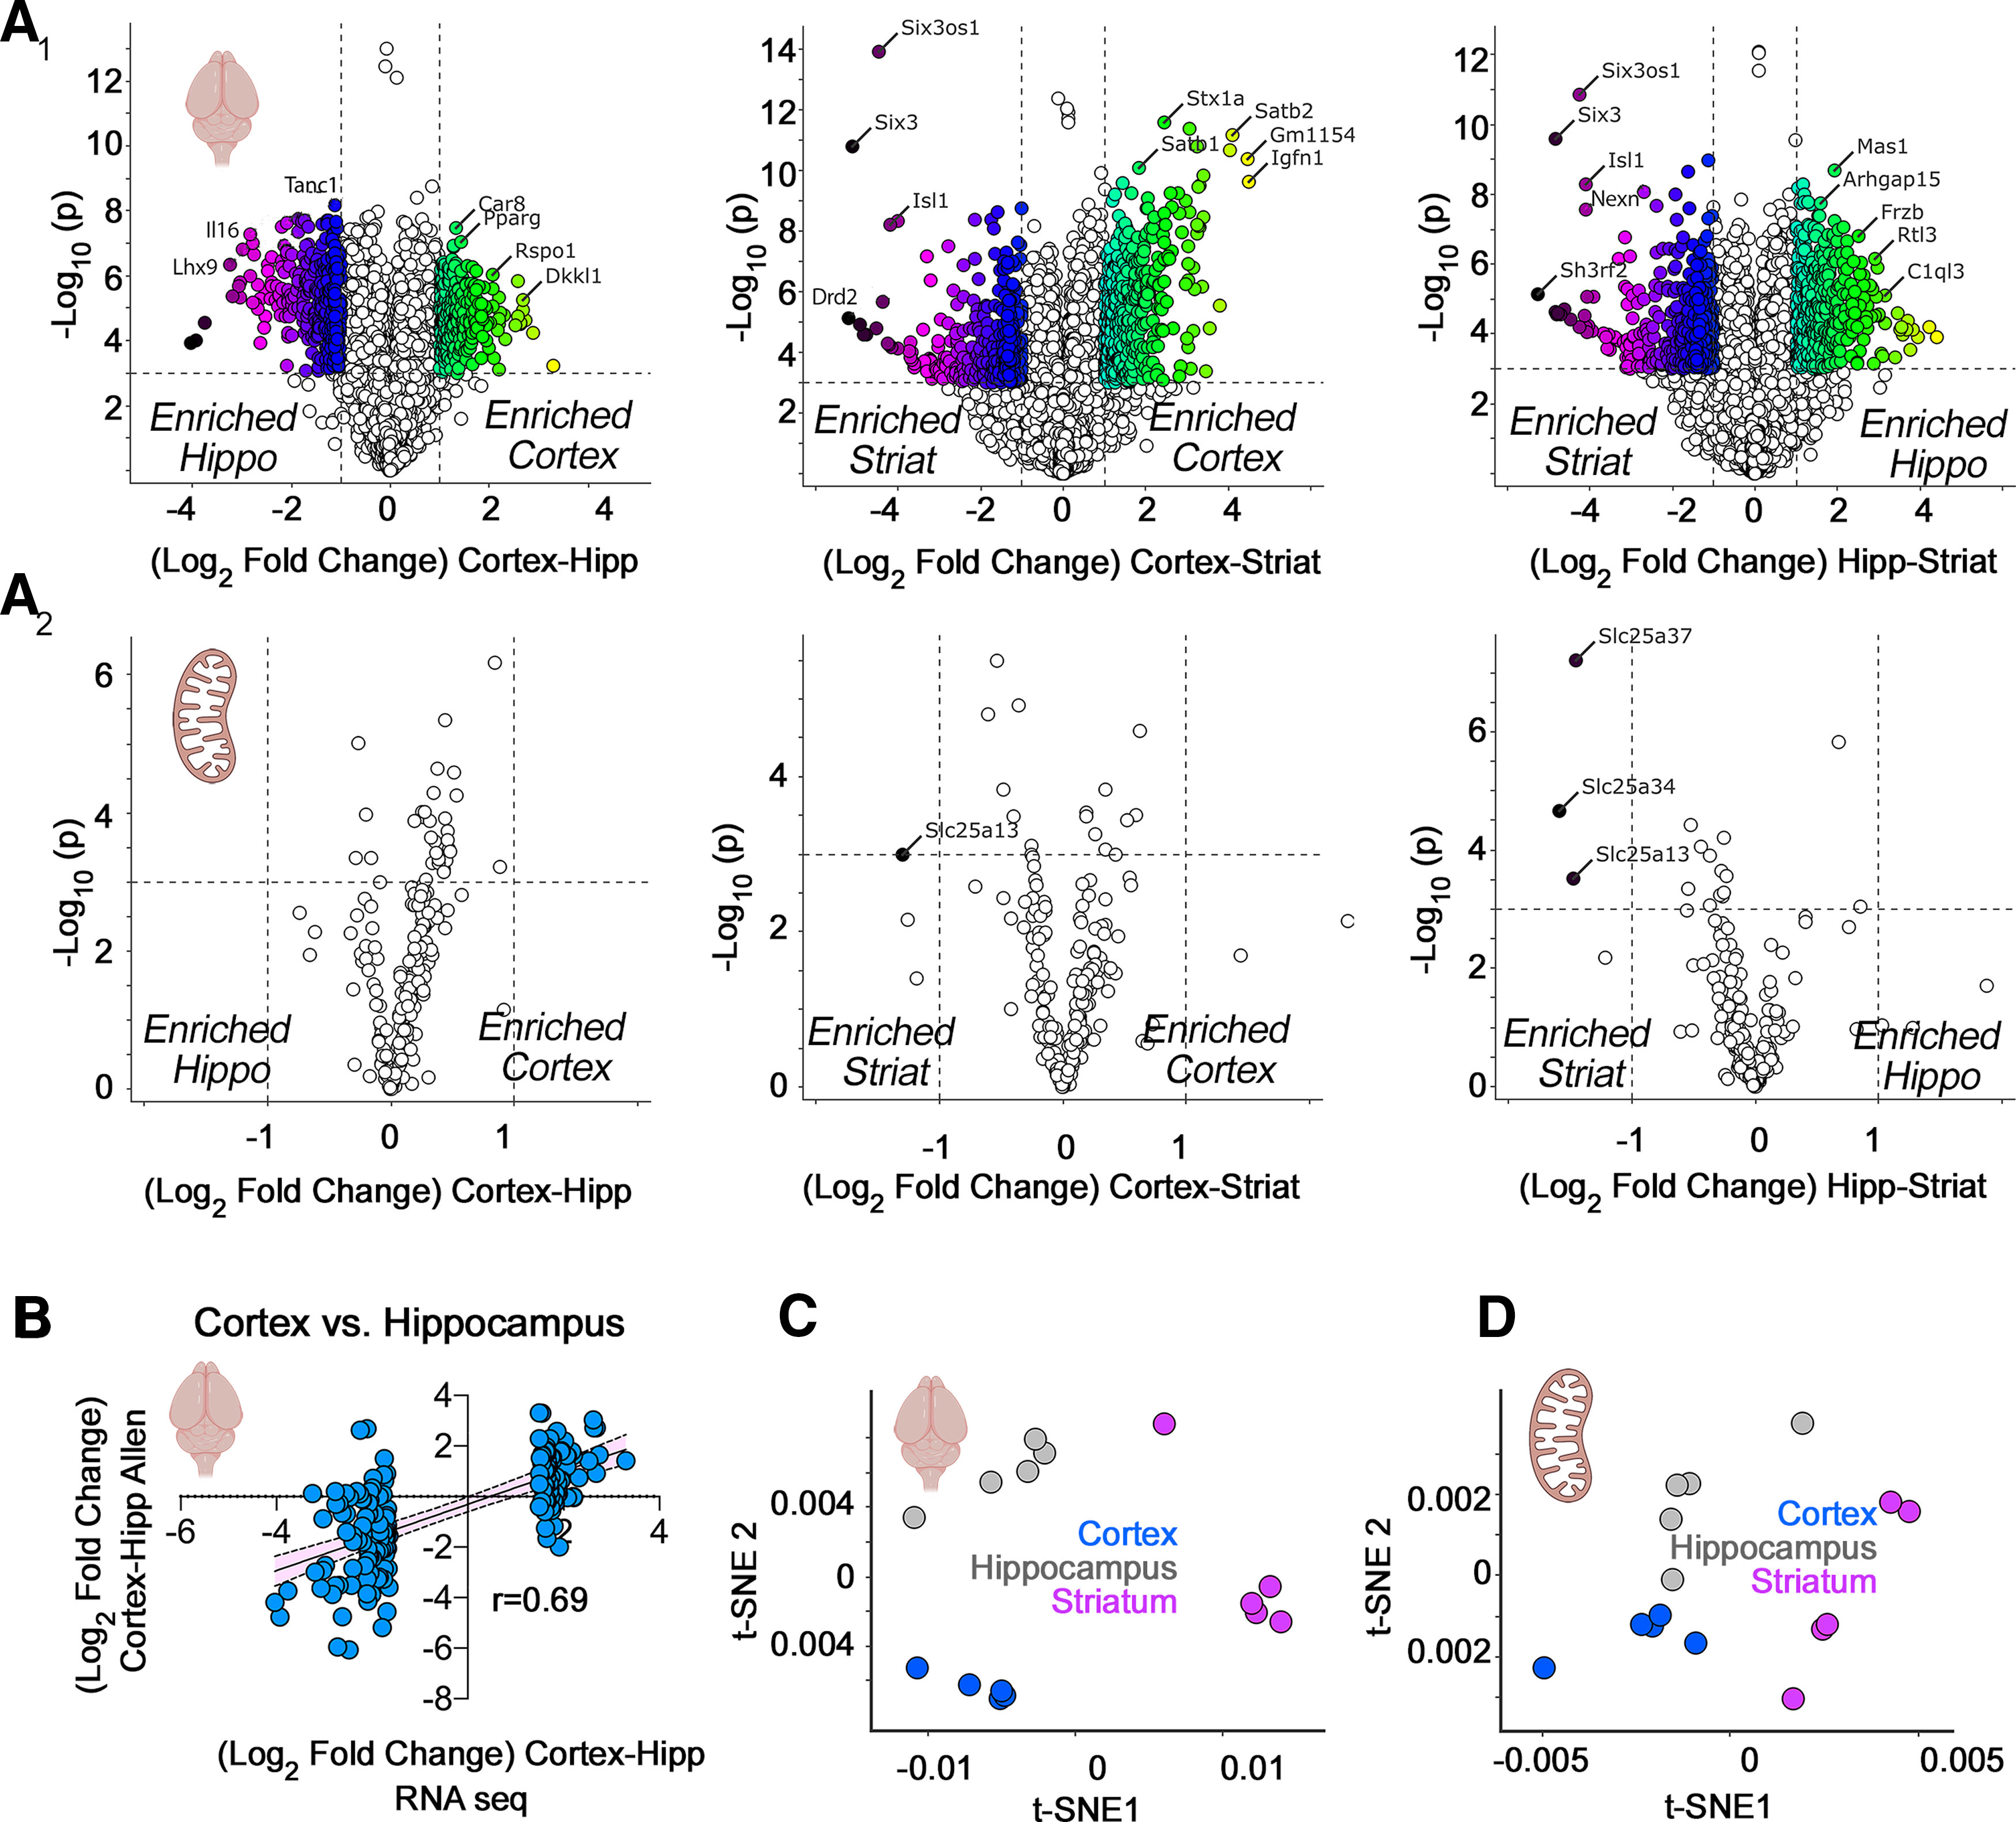
Figure 1.

RNAseq analysis of microdissected mouse brain regions. A1, A2, Volcano plots of cortex compared with hippocampus, cortex compared with striatum, and hippocampus compared with striatum from adult male mice (n = 5). Threshold for significance was set at p < 10−3 and log2 fold change at 1. Color code symbols depict the fold of change below or above the thresholds. A1, All transcripts quantified using DSeq2 annotated to the mouse genome GRCm38. A2, All nuclear transcripts encoding subunits of the respiratory chain complexes, the mitochondrial ribosome, and the SLC25A family of transporters. Note that scarce numbers of these nuclear encoded mitochondrial transcripts show modest expression differences among brain regions. B, Validation of the RNAseq results using as a comparison the in situ hybridization data from the Allen Mouse Brain Atlas. The 100 most upregulated and downregulated genes when comparing cortex and hippocampus by RNAseq were correlated with the differences reported by the Allen data. C, t-SNE analysis of the RNAseq data presented in A1. D, t-SNE analysis of the data presented in A2.
