Figure 2.

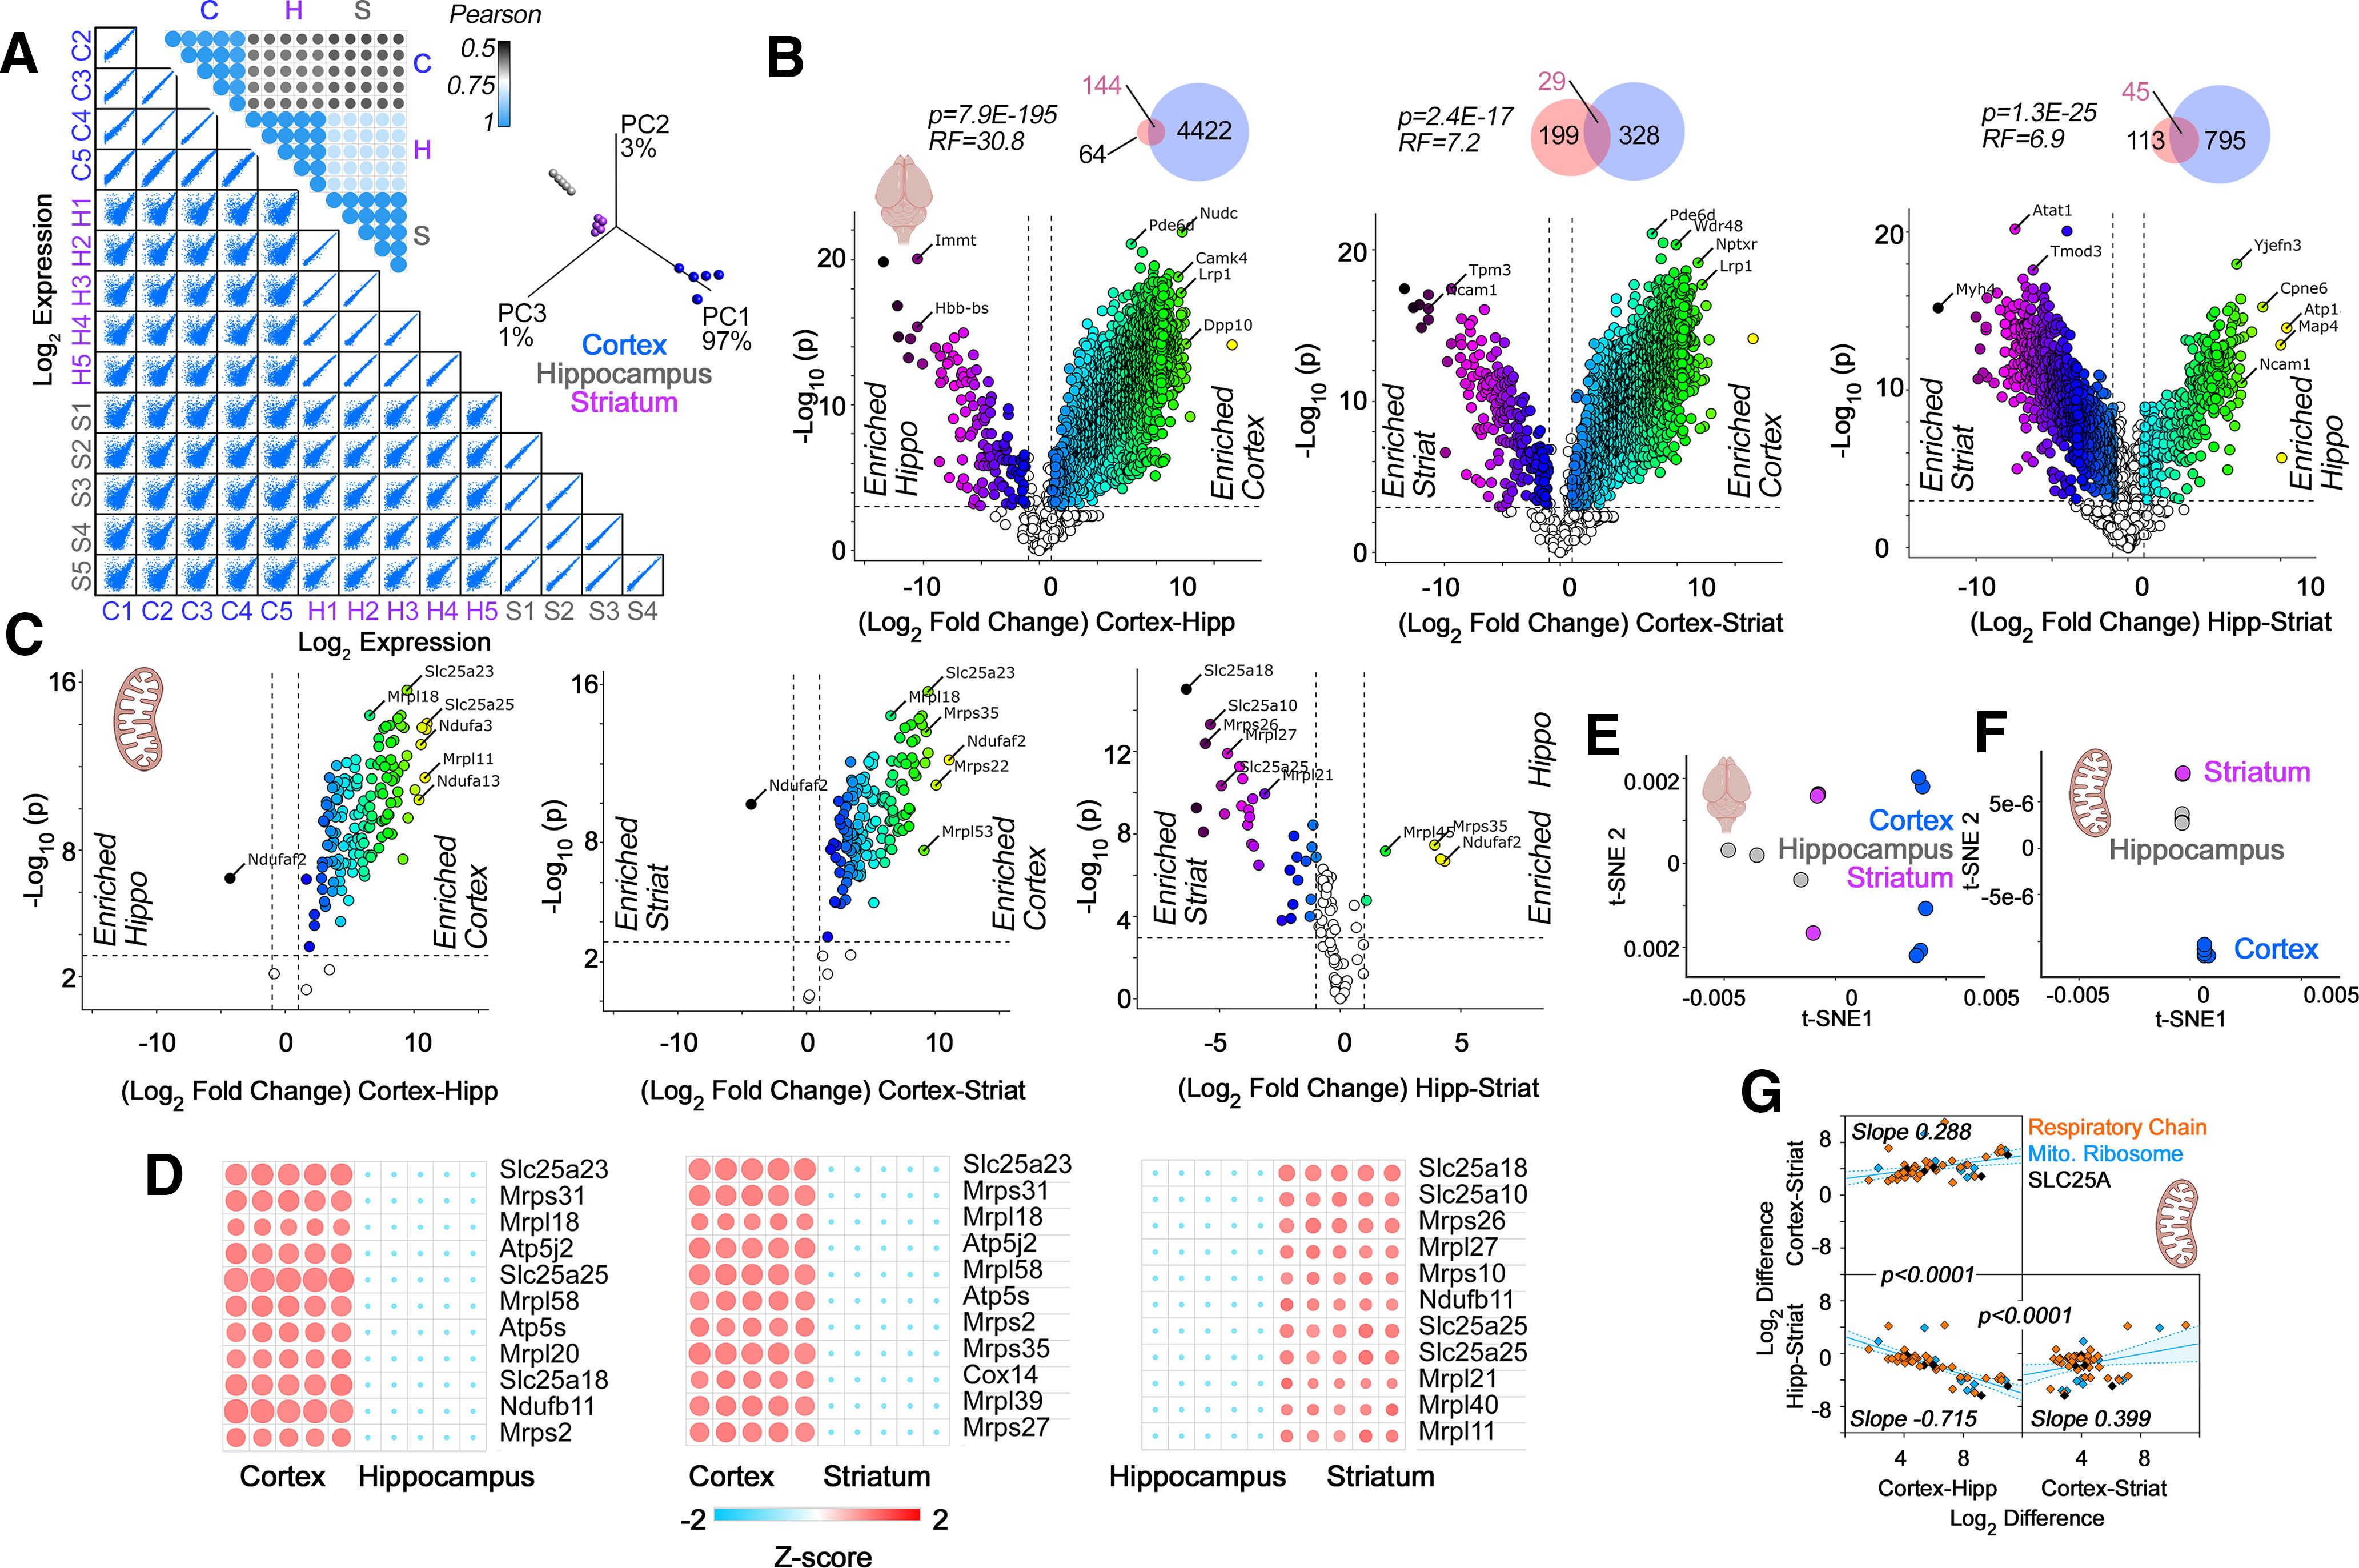
TMT proteomic analysis of microdissected mouse brain regions. A, Multiscatter plots with all individual biological replicates used for TMT quantifications. Insets, Pearson similarity coefficients and PCA of samples in multiscatter plots. B, C, Volcano plots of cortex compared with hippocampus, cortex compared with striatum, and hippocampus compared with striatum from adult male mice (n = 5). Threshold for significance were set at p < 10−3 and log2 fold change at 1. Color code symbols depict the fold of change below or above the thresholds. B, All proteins quantified in brain samples with inset Venn diagrams depicting the overlap between our TMT data (blue) and label-free quantifications by Sharma et al. (2015; pink). Representation factor and p values were estimated with an exact hypergeometric probability test. C, All nuclear encoded subunits of the respiratory chain complexes, the mitochondrial ribosome, and the SLC25A family of transporters. Note the abundant nuclear encoded mitochondrial proteins differentiating brain regions. D, Heat maps of the proteins that show the most pronounced changes based on the q value and magnitude of the difference. E, t-SNE analysis of the proteome data presented in B. F, t-SNE analysis of the data presented in C. Note that the best clustering of brain regions is obtained with the nuclear encoded mitochondrial proteins described in C. G, Simple linear correlation analysis of expression differences across brain regions. Proteins belonging to respiratory chain complexes, the mitochondrial ribosome, and the SLC25A family of transporters are color coded. Note the differences in slopes. p values describe the differences between adjacent correlation plots slopes obtained with Prism. Shaded area represents the 95% confidence interval. See Extended Data Figure 2-1 for list of protein hits with p < 10−3 and log2 fold change of least 1.
