Figure 3.

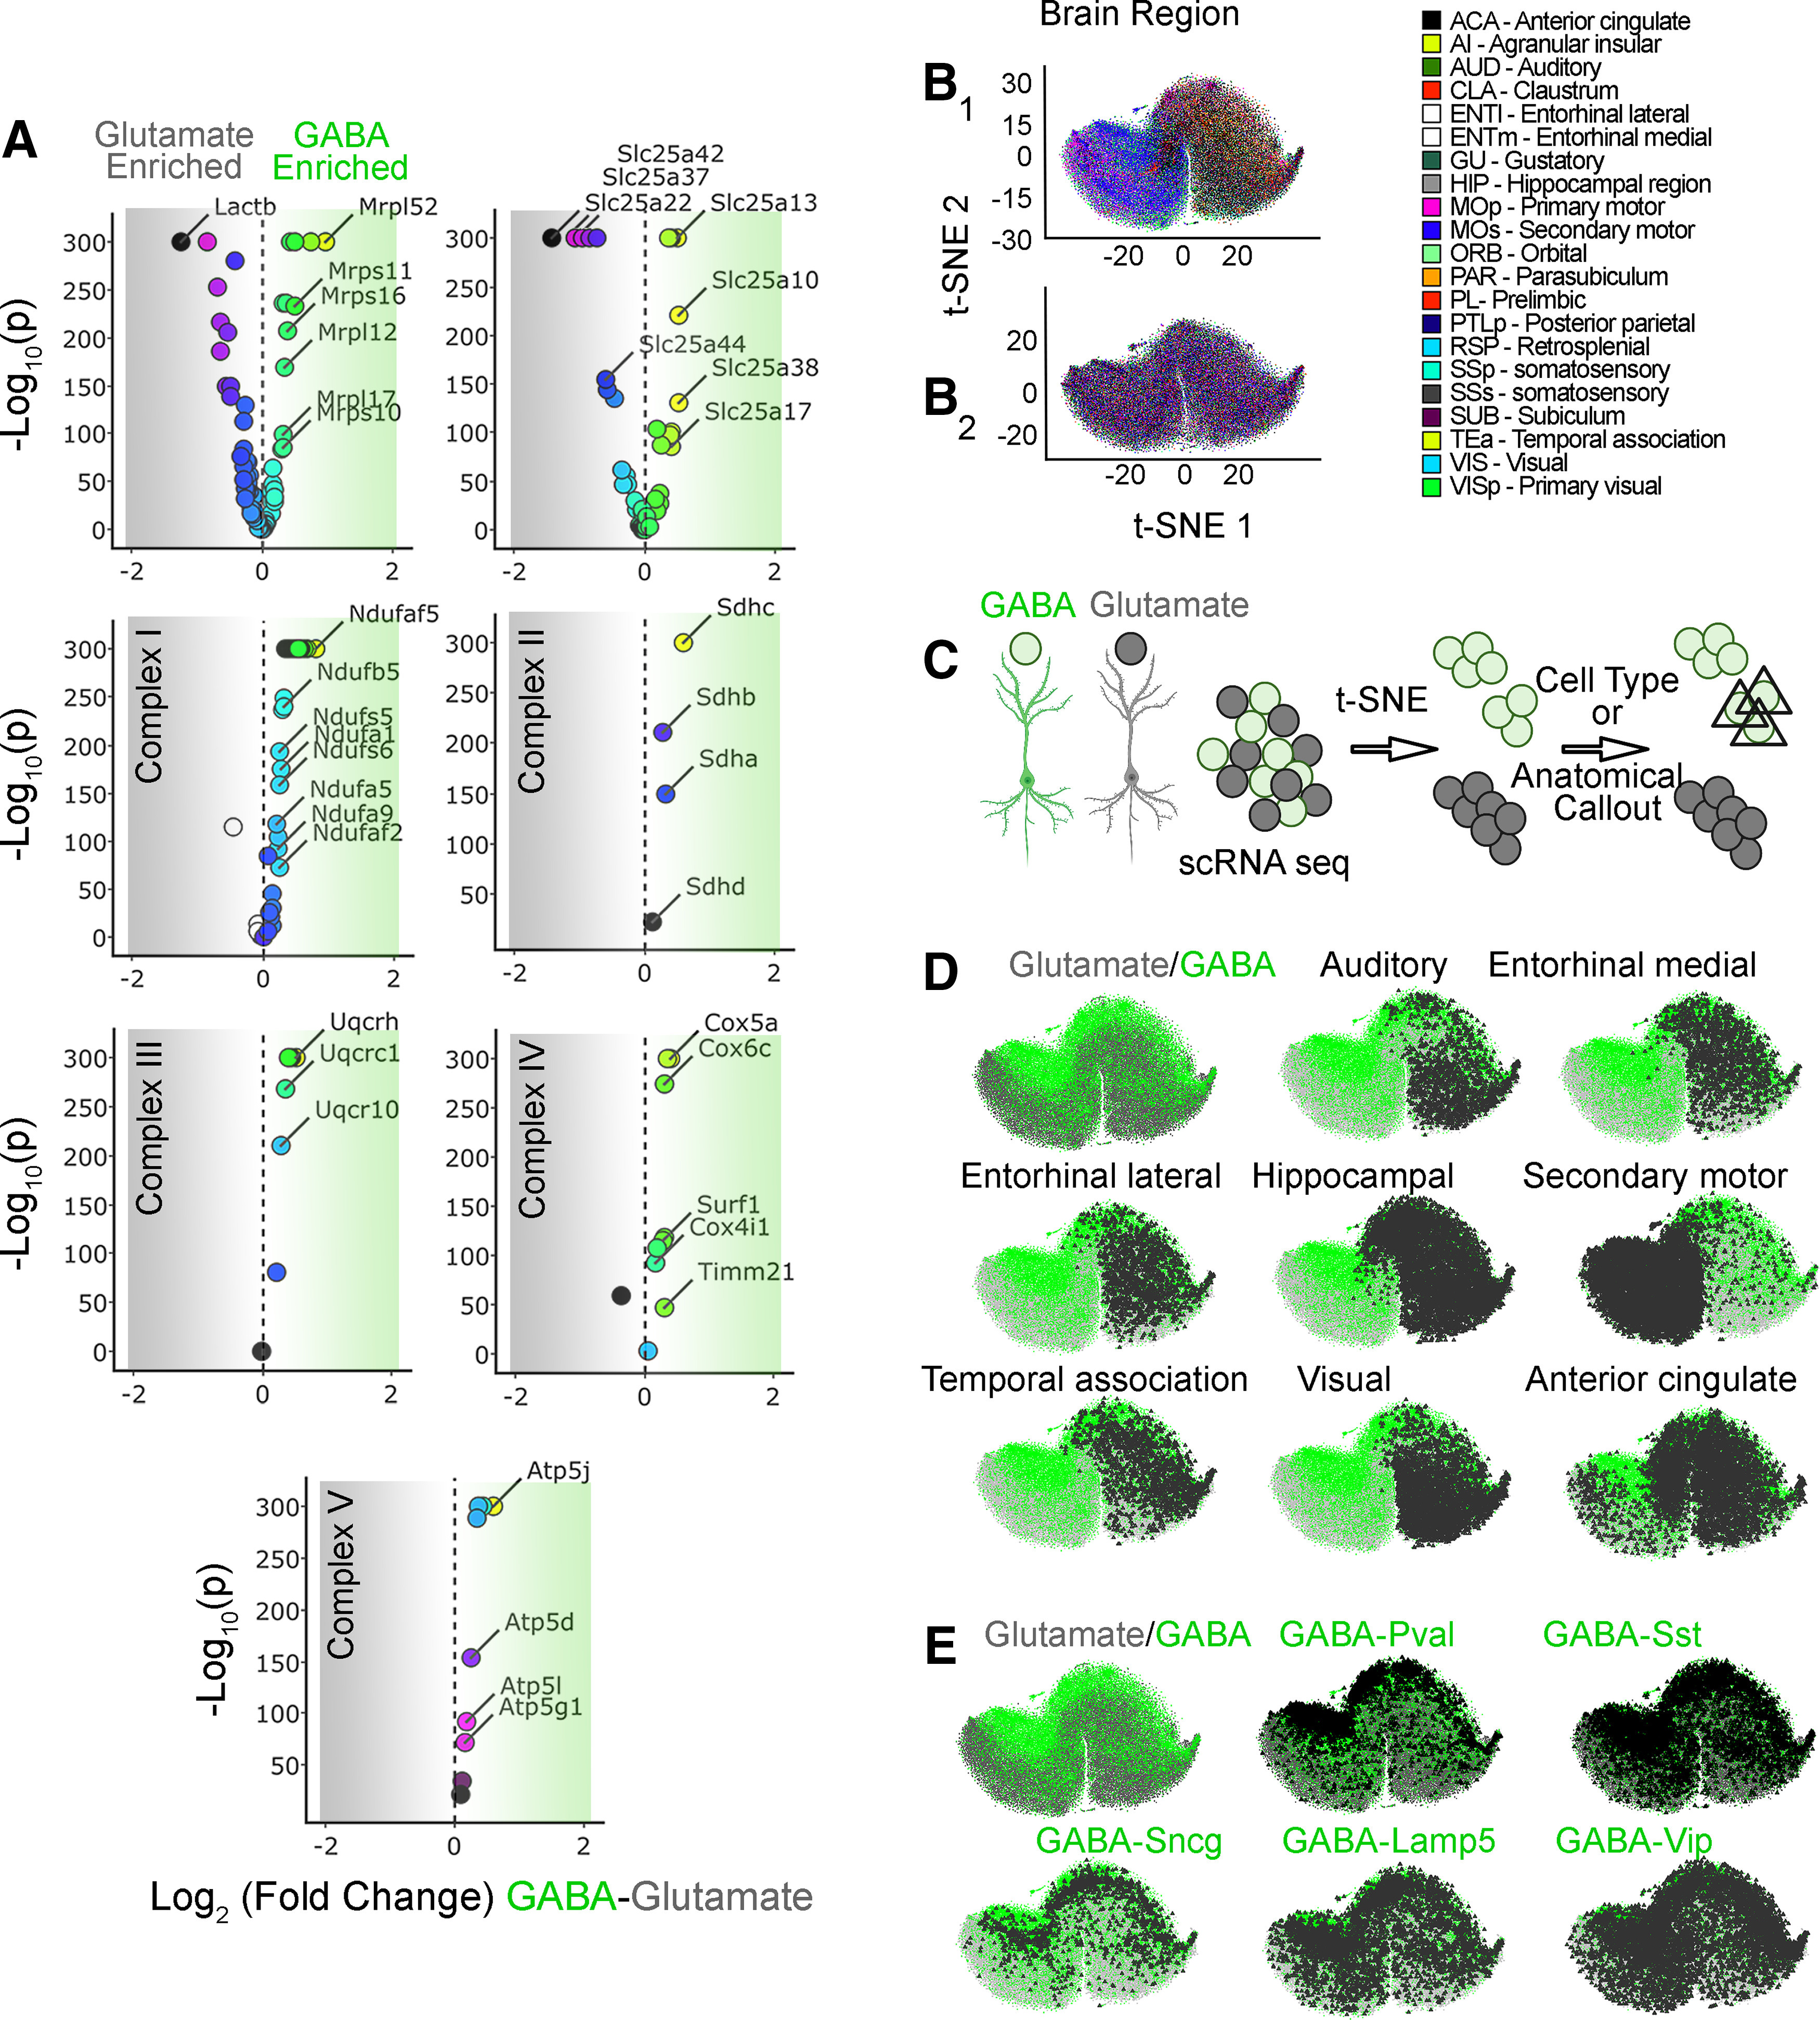
Nuclear encoded mitochondrial transcripts differentiate neurons by neurotransmitter identity and anatomical location. A, Volcano plots were assembled using the Allen single-cell RNAseq dataset. A total of 50,002 pyramidal glutamatergic neurons were compared with 22,745 GABAergic interneurons. Volcano plots are organized by subunits belonging to the mitochondrial ribosome, electron chain complexes I to V, and the SLC25A family of solute transporters. The mitochondrial ribosome and the SLC25A family of transporters are the most dissimilarly expressed transcripts when comparing GABAergic with glutamatergic neurons. B1, t-SNE cell atlas generated with the expression levels of all transcripts encoding mitochondrial ribosome subunits. The t-SNE atlas encompasses >20 areas of mouse cortex and hippocampus, totaling 76,307 cells. Color codes denote brain regions annotated by the Allen Brain Atlas. B2 shows B1 data after 100 consecutive permutations. Anatomical segregation is lost. C, Diagram explaining strategy for cell type and anatomic callout in t-SNE atlases. GABAergic neurons were color-coded green and glutamatergic neurons were color coded gray. Cell type and anatomic region were marked by a triangle. D, t-SNE atlas shown in B1 that was layered with the neurotransmitter identity of cells and anatomic location of cells (triangles). GABA, parvalbumin (Pval), somatostatin (Sst), γ-synuclein (Sncg), vasointestinal peptide (Vip), and lysosomal-associated membrane protein family member 5 (Lamp5) denote markers defining specific interneuron subpopulations. E, t-SNE atlas shown in B1 but layered with the subtype of interneuron (triangles).
