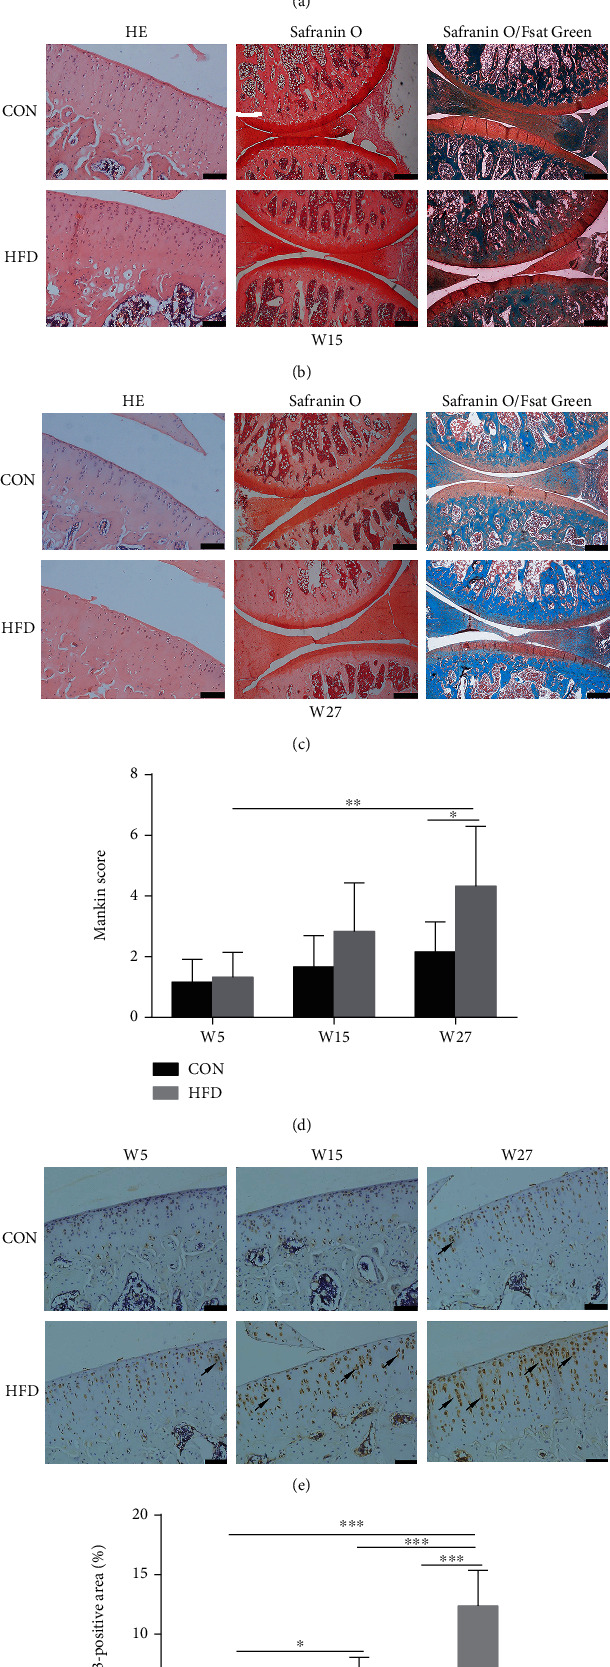
Figure 3.

The effect of HFD on knee joints of rats. H&E staining (original magnification, 100x; scale bars = 100 μm), Safranin O staining (original magnification, 40x; scale bars = 200 μm), and Safranin O/Fast Green staining (original magnification, 40x; scale bars = 200 μm) at W5 (a), W15 (b), and W27 (c). Mankin scores corresponding to the pathological changes of knee joint (d). Analysis of MMP-13-positive area (original magnification, 200x, scale bars = 50 μm) was measured by immunohistochemical analyses (e, f) and represented by arrows. Data were presented as mean ± SD, n = 5. Independent sample t-test and one-way ANOVA were used to conduct statistical significance. Significant expression differences are shown as ∗P < 0.05, ∗∗P < 0.01, and ∗∗∗P < 0.001.
