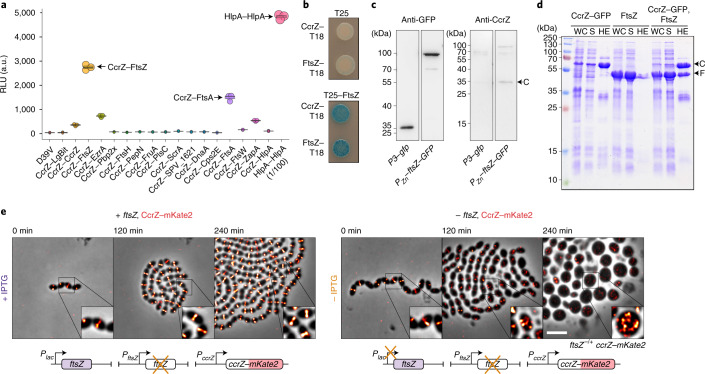
Fig. 3. CcrZ interacts directly with FtsZ.
a, Split-luciferase assay using several combinations with CcrZ–LgBit reveals that CcrZ and FtsZ are in very close proximity, as indicated by a high luminescence signal. FtsA, EzrA and ZapA, all three interacting directly with FtsZ, also gave a slight signal. hlpA–LgBit hlpA–SmBit (HlpA–HlpA), here diluted 100 times, is used as a positive control. Each dot represents the average of n = 15 measurements of a technical replicate, with the size of the dot representing the s.e.m. RLU, relative luminescence units. b, FtsZ–CcrZ interaction confirmation by bacterial two-hybrid assay. T25 is the empty vector pST25 and T25–FtsZ corresponds to vector pST25–FtsZ used in combination with pUT18–CcrZ (CcrZ–T18) and pUT18–FtsZ (FtsZ–T18). c, Affinity purification of FtsZ–GFP from S. pneumoniae cells (second lane) also pulls down untagged CcrZ (fourth lane). Purification of GFP alone (first lane) did not pull-down CcrZ (third lane). d, FtsZ from S. pneumoniae expressed in E. coli copurifies with CcrZSp–GFP by affinity purification. WC, whole-cell extract; S, supernatant; HE, heat-eluted products; C, CcrZ–GFP; F, FtsZ. e, Epifluorescence time-lapse microscopy of CcrZ–mKate2 at 37 °C in the presence (left) or absence (right) of FtsZ. When FtsZ amounts are reduced, cells increase their size and CcrZ is delocalized from the mid-cell. Scale bar, 3 µm.

