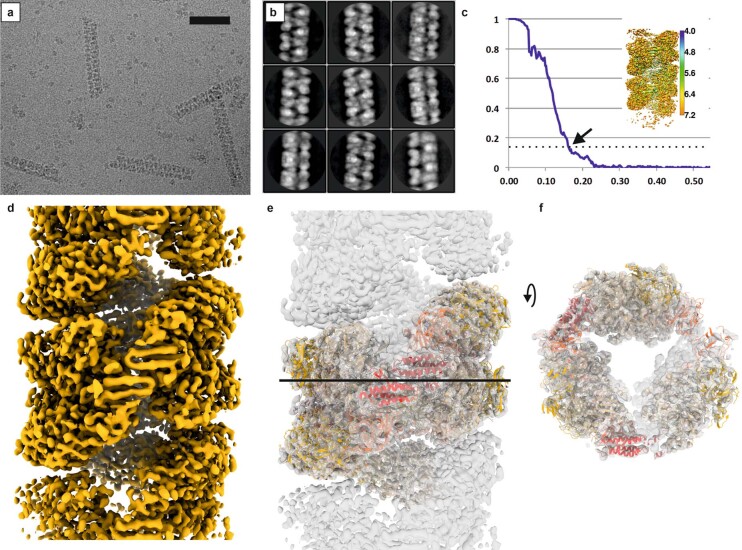
Extended Data Fig. 6. Helical reconstruction of the anammoxosomal NXR tubules.
a, Raw micrograph of anammoxosomal tubules, representative of the entire pool of 1,753 micrographs. b, Selection of 2D reference-free class averages of tubules sorted by RELION3.1 in different orientations. c, Gold-standard FSC plots between two separately refined half-maps are shown in blue. The map resolution is indicated by the point where the curve drops below the 0.143 threshold. Inset right: helical reconstruction cryo-EM map of tubules colored by local resolution as analyzed by ResMap74. d, Cryo-EM map after density modification with phenix.resolve_cryo_em75 which improved the map quality to a resolution of 5.8 Å. e, f, Fit of the crystal structures of KsNXR-ABC and KsNXR-T and slice through the cryo-EM map.

