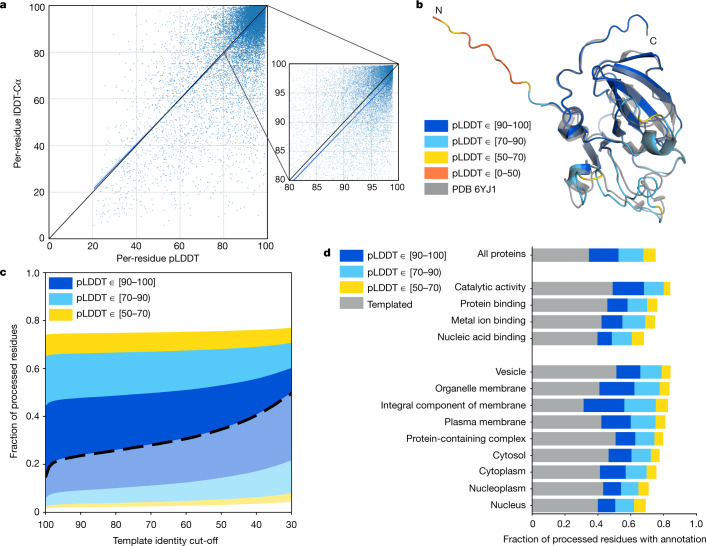
Fig. 1. Model confidence and added coverage.
a, Correlation between per-residue pLDDT and lDDT-Cα. Data are based on a held-out set of recent PDB chains (Methods) filtered to those with a reported resolution of <3.5 Å (n = 10,215 chains and 2,756,569 residues). The scatterplot shows a subsample (1% of residues), with the blue line showing a least-squares linear fit and the shaded region a 95% confidence interval estimated with 1,000 bootstrap samples. The black line shows x = y, for comparison. The smaller plot is a magnified region of the larger one. On the full dataset, the Pearson’s r = 0.73 and the least-squares linear fit is y = (0.967 ± 0.001) × x + (1.9 ± 0.1). b, AlphaFold prediction and experimental structure for a CASP14 target (PDB: 6YJ1)64. The prediction is coloured by model confidence band, and the N terminus is an expression tag included in CASP but unresolved in the PDB structure. c, AlphaFold model confidence on all residues for which a prediction was produced (n = 10,537,122 residues). Residues covered by a template at the specified identity level are shown in a lighter colour and a heavy dashed line separates these from residues without a template. d, Added residue-level coverage of the proteome for high-level GO terms, on top of residues covered by a template with sequence identity of more than 50%. Based on the same human proteome dataset as in c (n = 10,537,122 residues).

