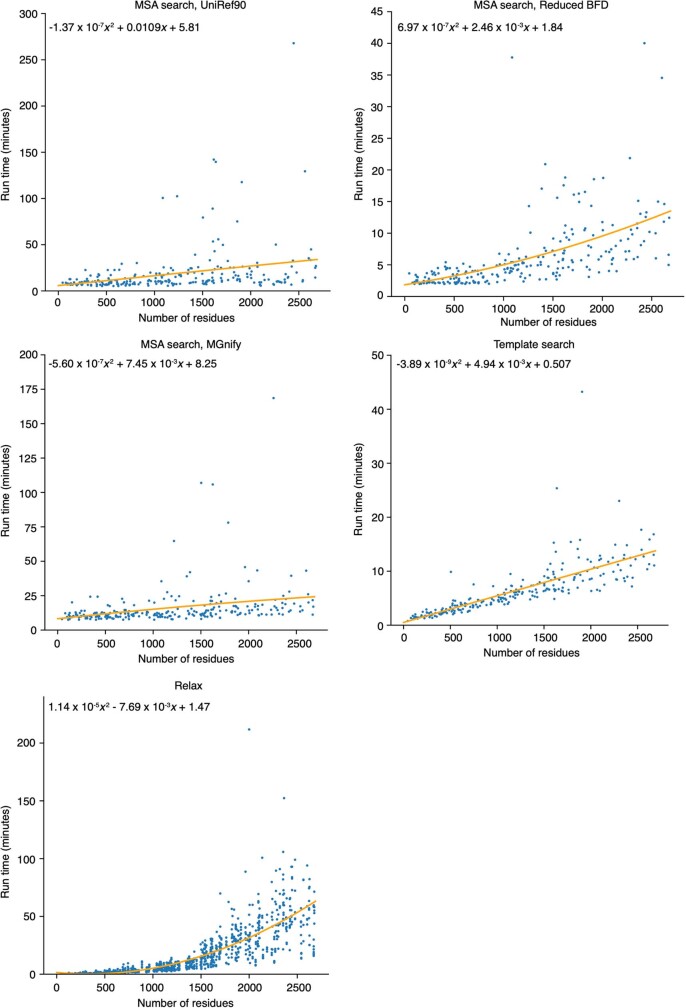
Extended Data Fig. 7. Relationship between sequence length and run time for the non-inference stages of the pipeline.
On the basis of 240 human protein sequences, chosen by stratified sampling from the length buckets: [16, 500), [500, 1,000), [1,000, 1,500), [1,500, 2,000), [2,000, 2,500) and [2,500, 2,700]. The relax plot shows five times more points, since five relaxed models are generated per protein. Coefficients for the quadratic lines of best fit were computed with Numpy polyfit.

