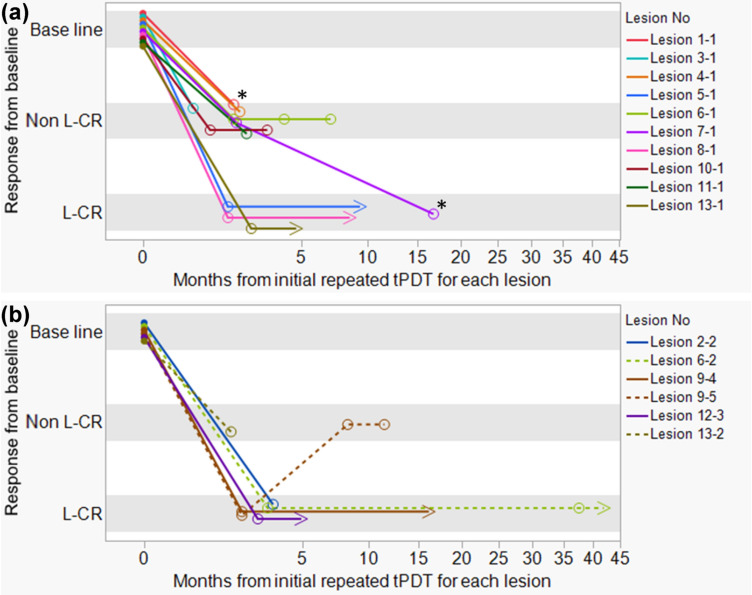
Fig. 3.
Time course of the response of repeated taraporfin PDT (tPDT). Horizontal axis indicates the month after initial repeated tPDT for each lesion. Zero month means the date of initial repeated tPDT for each lesion. Vertical axis indicates the response to each repeated tPDT. Baseline means the target lesions’ status before repeated tPDT. a Time course of the response to repeated tPDT for the primary site. Of the 10 lesions, three lesions achieved L-CR by the second tPDT (Lesion 5–1, 8–1, 13–1). While seven lesions were non L-CR by the second tPDT, one lesion (Lesion 7–1) finally achieved L-CR by the third tPDT. b Time course of the response to repeated tPDT for the metachronous site. Of the six lesions, five lesions (Lesion 2–2, 6–2, 9–4, 9–5, 12–3) achieved L-CR by the second or third tPDT (Supplemental Table 1). While two lesions (Lesion 6–2, Lesion 9–5) showed progression after L-CR by the second or third tPDT, one (Lesion 6–2) achieved L-CR again by the repeated tPDT. Primary site means the lesion treated with the first tPDT. Metachronous site means any lesion other than the lesion treated with the first tPDT. Baseline: target lesion status before the initial repeated tPDT for each lesion. Non L-CR: local non complete response, L-CR: local complete response. 〇: best response to repeated tPDT. > : last date of L-CR confirmation. *: Lesion 1–1 and Lesion 7–1 were treated again by repeated tPDT; however, these lesions were not evaluated at timing of this analysis

