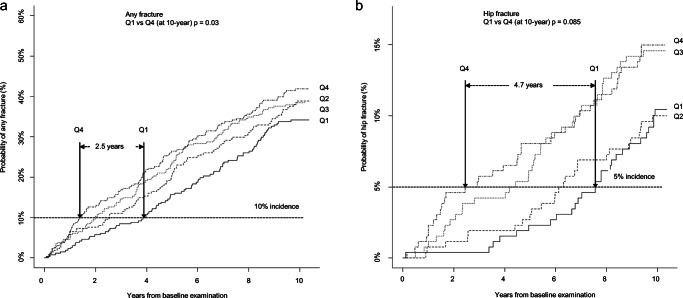
Fig. 2.
Cumulative incidence of a any fracture and b hip fracture, stratified by quartiles of frailty at age 75, calculated in the presence of the competing risk of death. Differences in cumulative incidence rates between Q1 and Q4 was tested using Gray’s test. The graphs show that among the least frail (Q1), fracture accumulation occurs between 2.5 (any fracture) and 4.7 years (hip fracture) later, i.e., they remain fracture free for longer compared to the most frail women (Q4). *Frailty quartiles Q1 (≤ 0.11), Q2 (0.12–0.16), Q3 (0.17-0.24), and Q4 (≥ 25)

