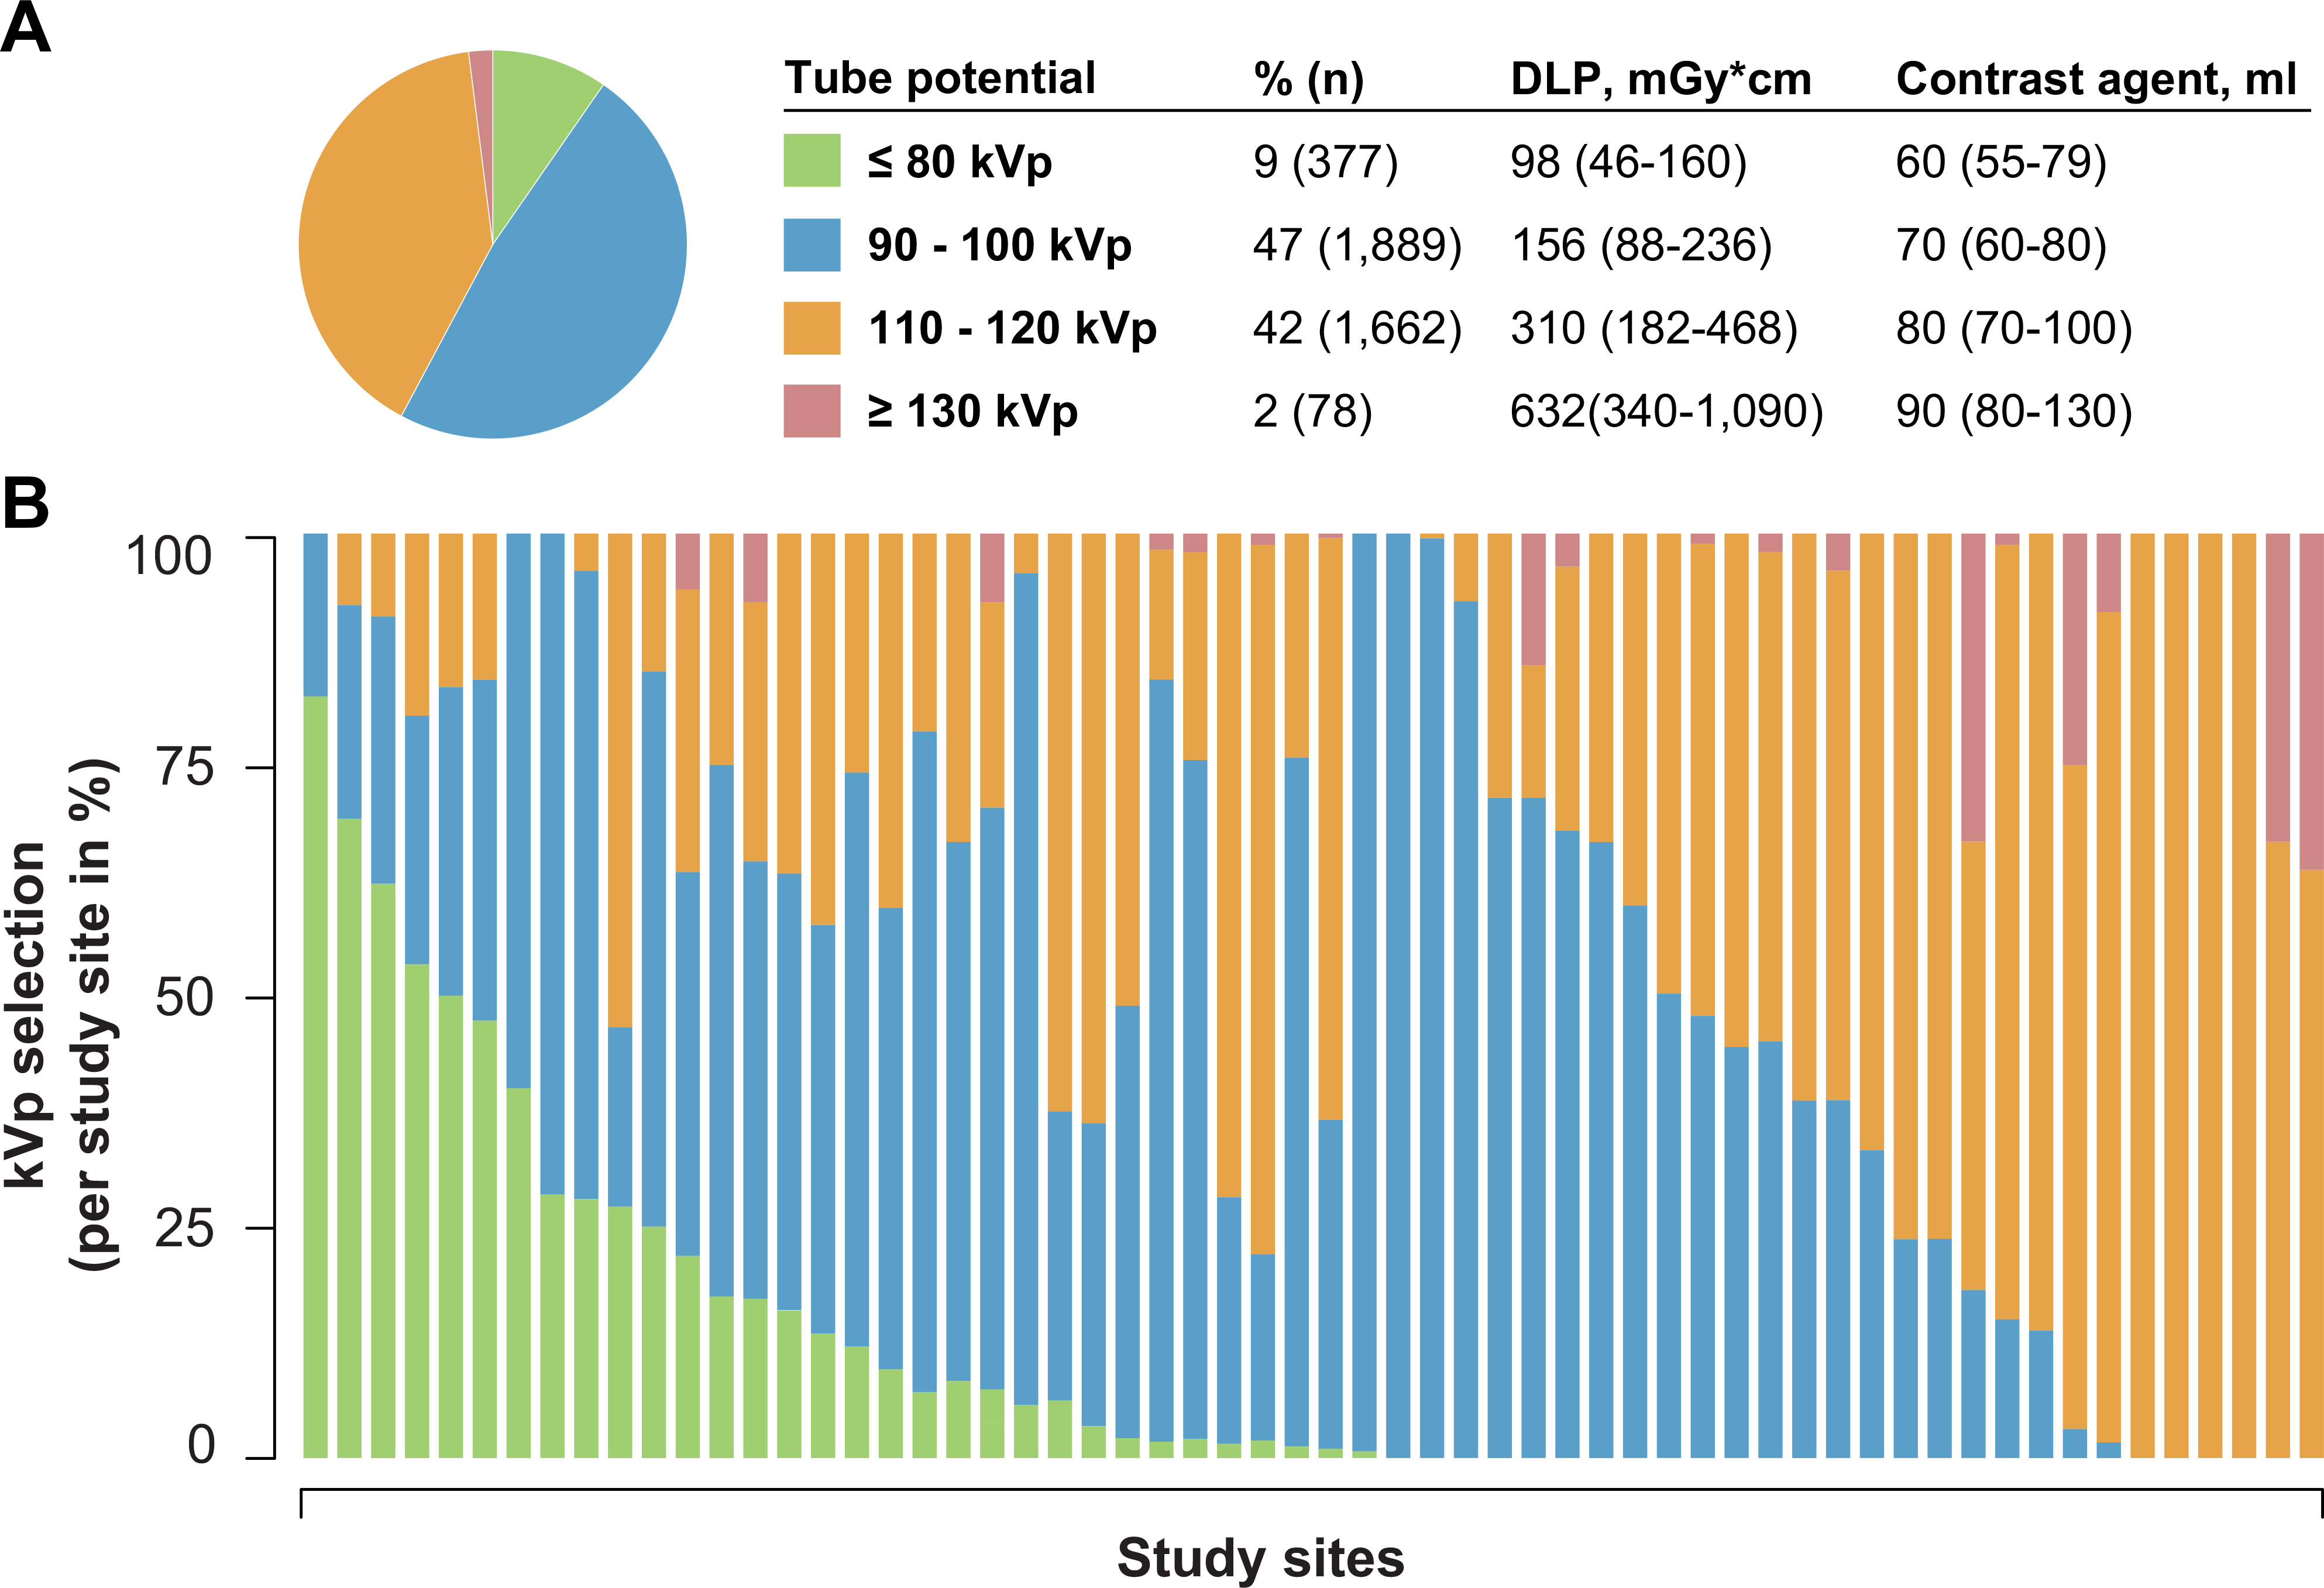
Central illustration, Figure 1: Application of tube potential protocols in current clinical routine CCTA imaging.

A: Frequency of different tube potential protocols aggregated to ≤ 80-kVp, 90–100-kVp, 110–120-kVp and ≥ 130-kVp. B: Variation of tube potential protocol selection per study site.
