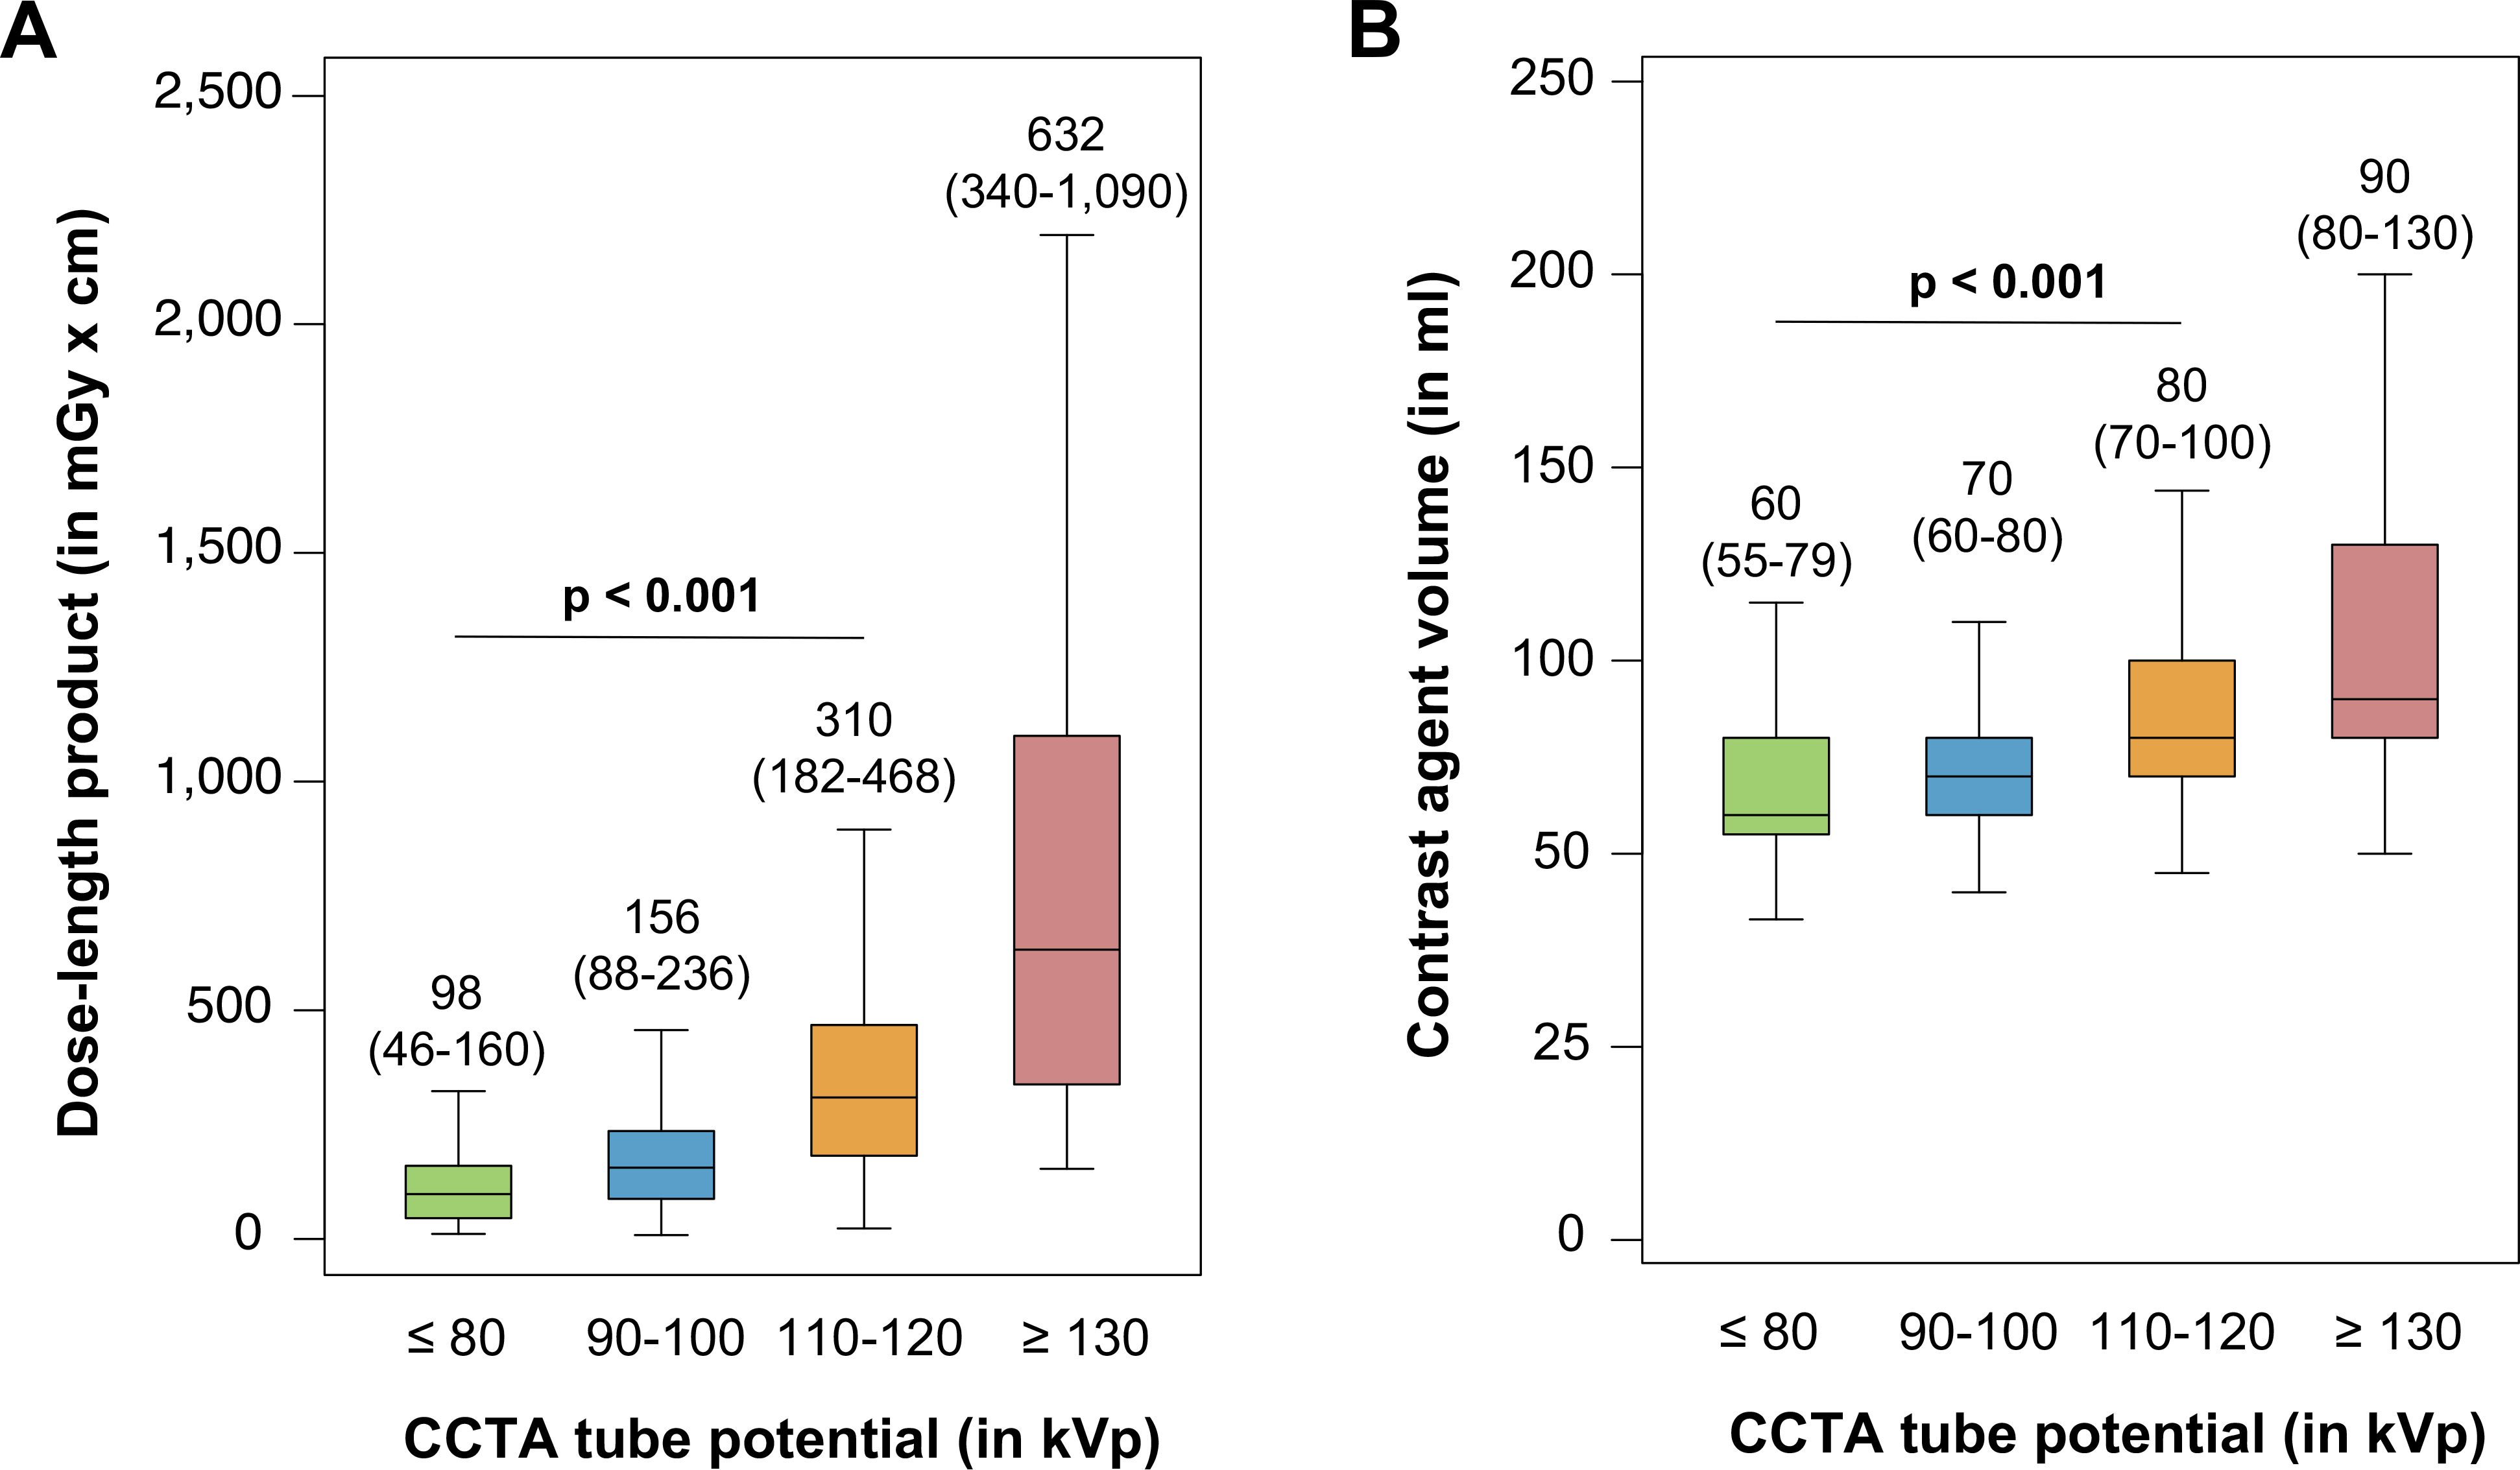
Figure 3: Impact of tube potential reduction on dose-length product and contrast agent volume in CCTA imaging.

Median dose-length product (A) and median contrast agent volume (B) per tube potential protocol. The middle horizontal line represents the median, the box shows the interquartile range (IQR), and error bars show the range of non-outlying data points (whiskers). The lower whisker shows the lowest data point within the 25th percentile minus 1.5 times IQR and the upper whisker shows the highest data point within the 75th percentile plus 1.5 times IQR.
