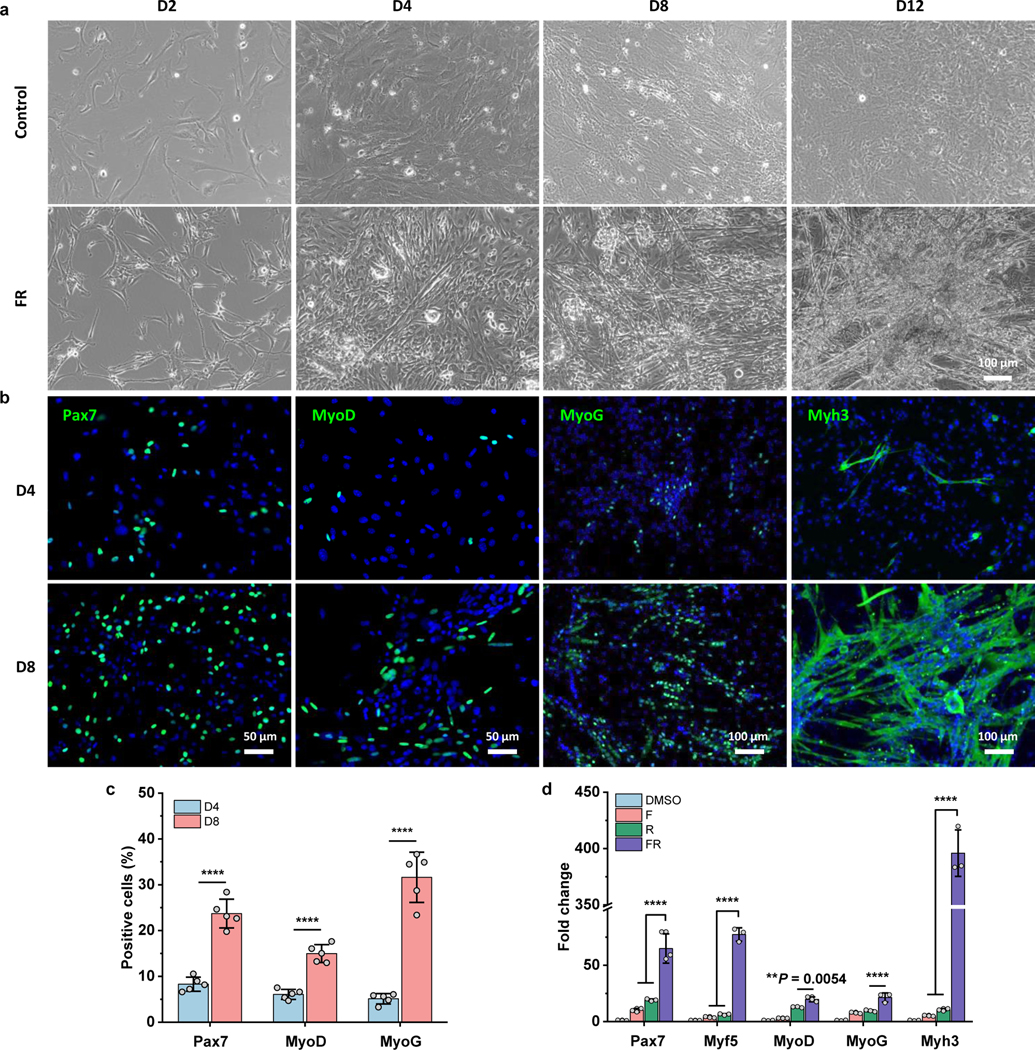
Fig. 2 |. Characterization of chemical-induced myogenic stem cells (CiMCs).
a, Representative bright-field images of dermal cells treated with control Fb medium (top panels) or FR medium (bottom panels) on day 2, 4, 8 and 12 (panels from left to right) (n = 3 samples per group, n = 5 fields of view per group). b, Immunofluorescence analysis of skeletal muscle cell markers Pax7, MyoD, MyoG and Myh3 in CiMCs at day 4 (D4) and day 8 (D8) (n = 5 samples per group, n = 5 fields of view per group). c, The percentage of positive cells in (b) (n = 5 samples per group). d, qRT-PCR analysis for the indicated skeletal muscle genes of CiMCs at day 8. Fold change represents the normalized mRNA expression to DMSO group. Organic solvent DMSO was used as a negative control, due to it was used to dissolve small molecules (n = 3 samples per group). Data are presented as mean ± SD. Two-tailed Student’s t-test. **P < 0.01 and ****P < 0.0001.

