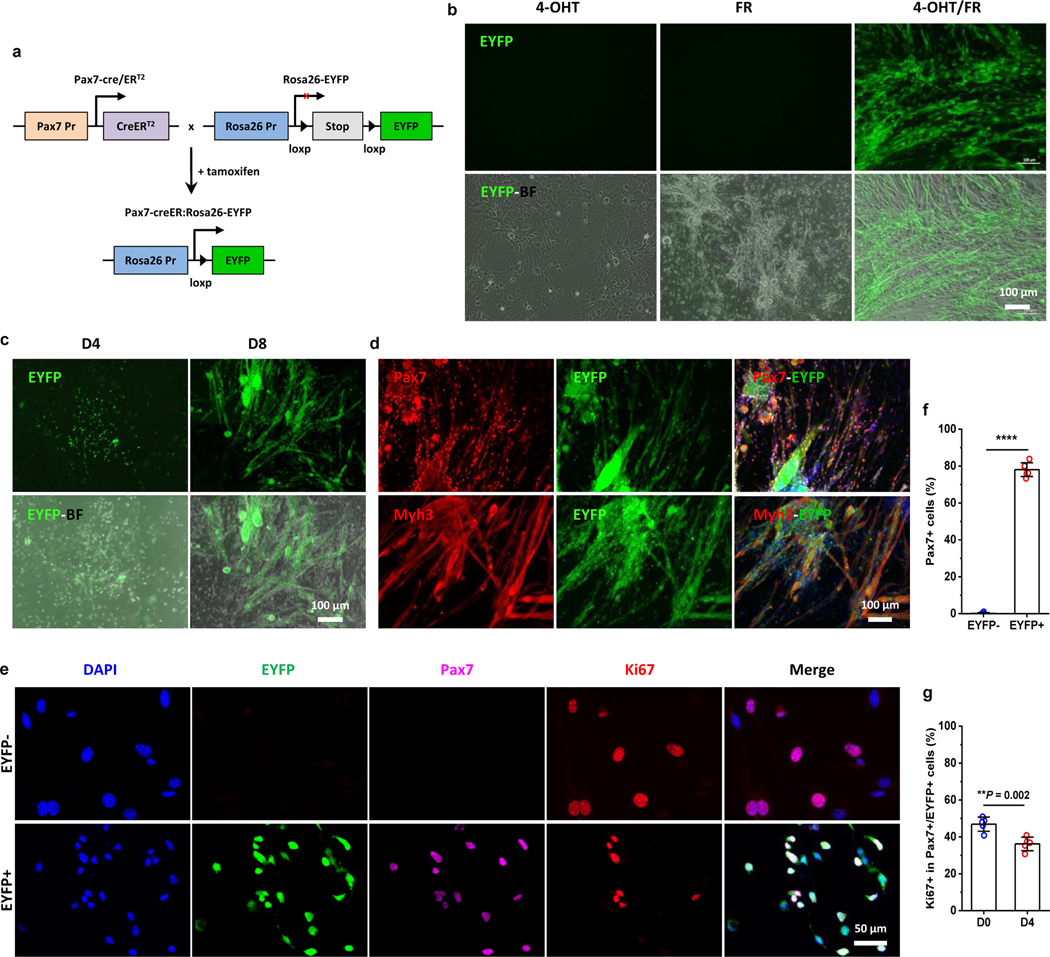
Fig. 5 |. Dermal Pax7+ subpopulation is the main contributor to the expanded CiMCs.
a, Breeding schematic of lineage-tracing and tamoxifen-inducible Pax7-creER:Rosa26-EYFP mice. b, Representative fluorescent (top panel) and merged fluorescence and bright field (EYFP-BF, bottom panel) images of Pax7 lineage-tracing SACs treated with 4-OHT, FR or 4-OHT with FR (4-OHT/FR) for 12 days (n = 3 samples per group, n = 5 fields of view per group). c, Selective expansion of SACs from transgenic mice treated with FR medium on day 4 and day 8 (from left to right) (n = 3 samples per group, n = 5 fields of view per group). d, Immunofluorescence staining for Pax7 (top panel) and Myh3 (bottom panel) in CiMCs from Pax7 lineage-tracing SACs treated with FR medium for 12 days. 4-OHT was added in the Fb medium during cell seeding and 24 hours before the culture medium was replaced with FR medium (n = 3 samples per group, n = 5 fields of view per group). e, Immunofluorescence staining for Pax7 and Ki67 in FACS sorted EYFP- (top) and EYFP+ (bottom) cells from day 4 Pax7 lineage-tracing CiMCs, which were further treated with FR medium for another 4 days after FACS sorting; from left to right DAPI staining, EYFP, Pax7, Ki67 and merged images (n = 5 samples per group, n = 5 fields of view per group). f, The percentage of Pax7+ cells in (e) (n = 5 samples per group). g, The percentage of proliferating Ki67+ cells in Pax7+/EYFP+ CiMCs at day 0 (D0, 6 hours after plating) and day 4 (D4) (n = 5 samples per group). Data are presented as mean ± SD. Two-tailed Student’s t-test. **P < 0.01 and ****P < 0.0001.

