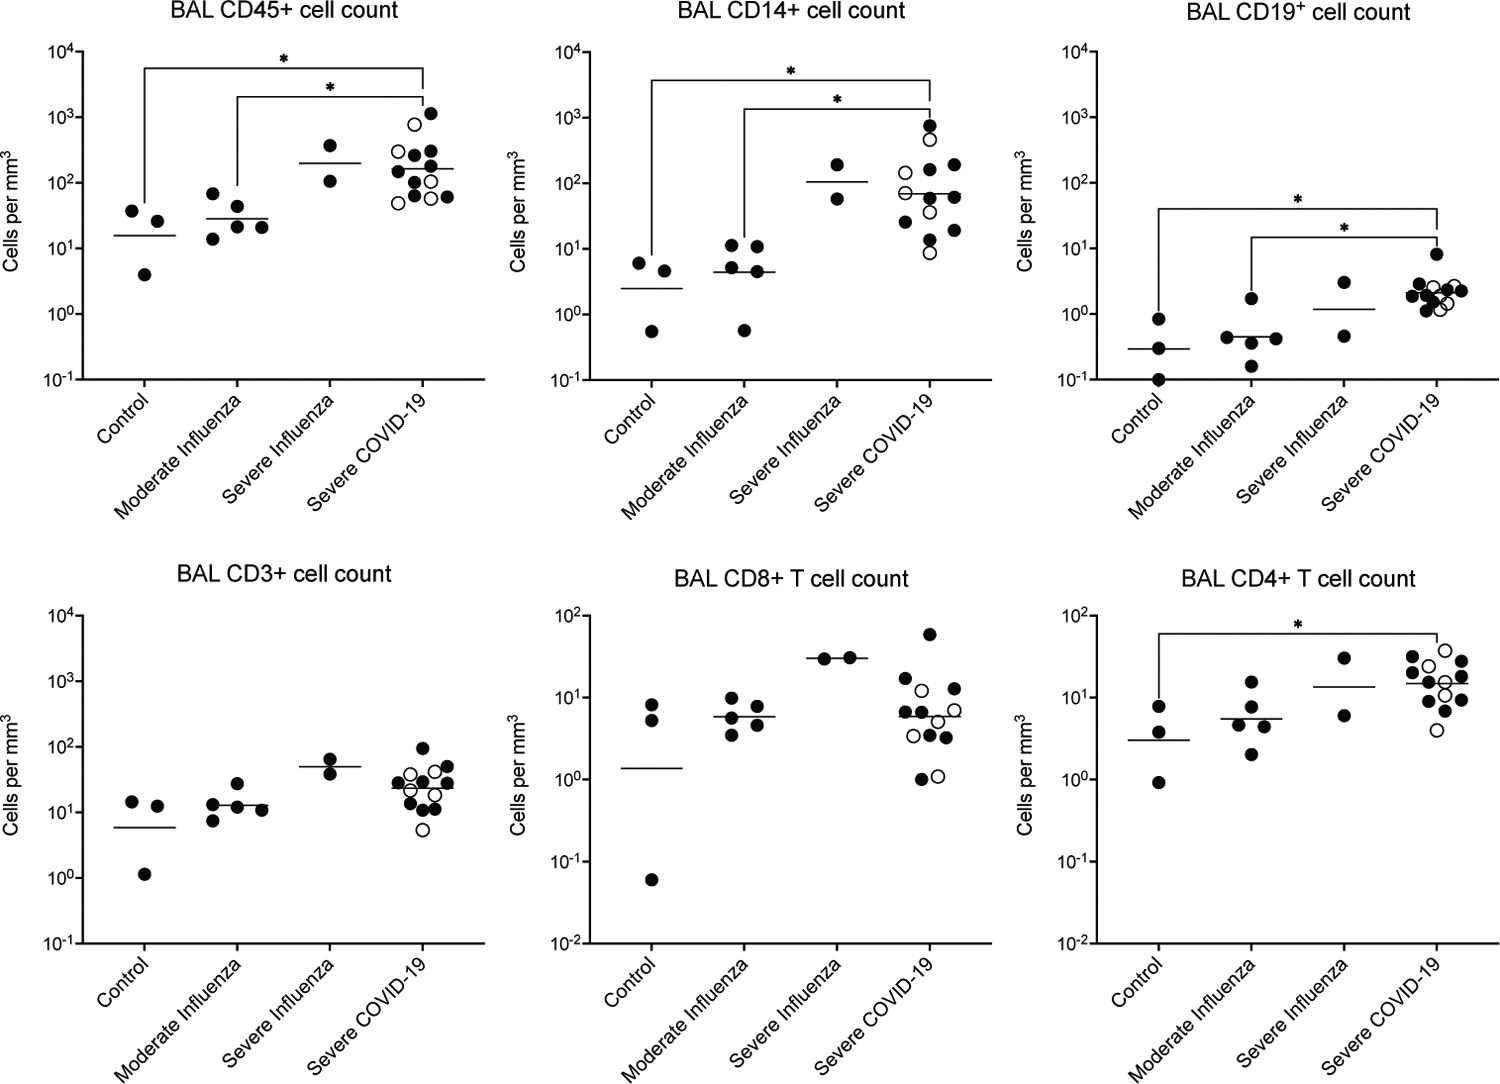
Figure 1.

Absolute number of various immune cell subsets in BAL. The indicated cell populations were quantified by flow cytometry using counting beads. Comparisons were made using Kruskal-Wallis ANOVA with Dunn’s multiple comparisons post-test. Significance is indicated by * P<0.05. Open symbols represent COVID-19 patients on chronic immunsuppressive therapy. There were no significant differences between the COVID-19 patients on chronic immunsuppresive therapy and those who were not in any of the measured variables.
