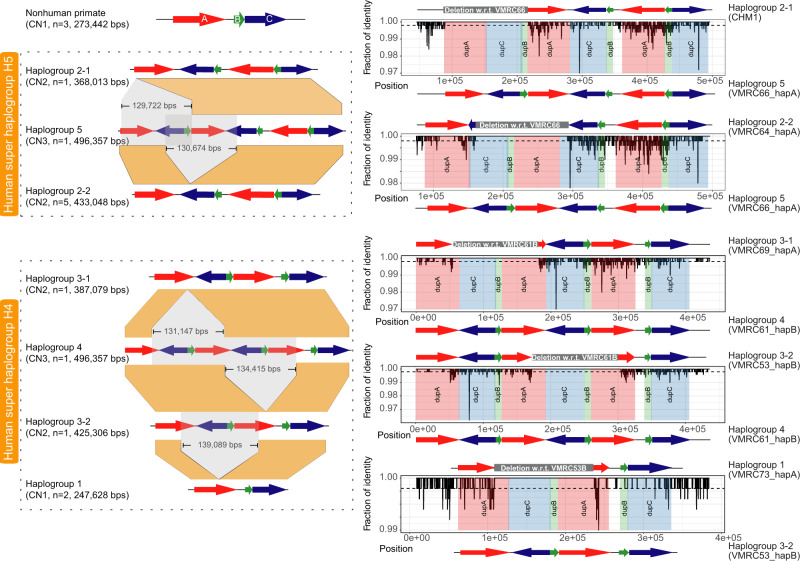
Fig. 2. Complex structural haplotype diversity at the 7q35 TCAF locus in humans.
Left panel: Schematic representations of the major- (super haplogroups H4 and H5) and sub-haplogroups identified from 15 targeted BAC long-read assemblies. Colored arrows are TCAF SDs, and the gray and orange areas indicate putative deletion events and orthologous sequences between haplogroups. For example, despite the similarity in structure, Haplogroup 2-1 and Haplogroup 2-2 likely resulted from different deletion events relative to Haplogroup 5 based on comparative sequence data. Right panel: The comparative sequence analysis between individual haplogroups shows pairwise sequence identities (black lines) over 500 bp windows (sliding by 100 bp). With each plot, colored rectangles correspond to TCAF SDs, while the white region embedded between DupA (red) and DupB (green) blocks represents a 12.3 kbp single-copy unique sequence. Gray rectangles above each sequence identity plot indicate the locations of putative structure variants (Supplementary Data 3).

